![]()
Frontline Learning Research Vol.11 No. 2 (2023) 31 - 48
ISSN 2295-3159
1Indian Institute of Technology Bombay, India
Article received 31 August 2022/ revised 23 February 2023/ accepted 14 September 2023/ available online 15 November 2023
Eye tracking technology enables the visualisation of a problem solver's eye movement while working on a problem. The eye movement of experts has been used to draw attention to expert problem solving processes in a bid to teach procedural skills to learners. Such affordances appear as eye movement modelling examples (EMME) in the literature. This work intends to further this line of work by suggesting how eye gaze data can not only guide attention but also scaffold learning through constructive engagement with the problem solving process of another human. Inferring the models’ problem solving process, be it that of an expert or novice, from their eye gaze display would require a learner to make interpretations that are rooted in the knowledge elements relevant to such problem solving. Such tasks, if designed properly, are expected to probe or foster a deeper understanding of a topic as their solutions would require not only following the expert gaze to learn a particular skill, but also interpreting the solution process as evident from the gaze pattern of an expert or even of a novice. This position paper presents a case for such tasks, which we call eye gaze interpretation (EGI) tasks. We start with the theoretical background of these tasks, followed by a conceptual example and representation to elucidate the concept of EGI tasks. Thereafter, we discuss design considerations and pedagogical affordances, using a domain-specific (chemistry) spectral graph problem. Finally, we explore the possibilities and constraints of EGI tasks in various fields that require visual representations for problem solving.
Keywords: EMME, eye tracking, visual problems, perceptual learning
In the last decade, eye movement capture has expanded its utility from being a research method for studying cognitive processes (Rayner, 1992, 2009) to a tool for instructional design (Chiu, 2016; Kok & Jarodzka, 2017). Eye gaze patterns of successful problem solvers can contain meaningful task relevant patterns (Thomas & Lleras, 2007; Grant & Spivey, 2003) and the viewing of such gaze patterns has been shown to improve problem solving performance (Litchfield & Ball, 2011; Litchfield et al 2010). The affordance of eye gaze displays to make attention observable has since been explored for designing multimedia instruction. One of the earliest such implementations were the eye movement modelling examples (EMME) for procedural problem solving tasks (van Gog et al., 2009). An EMME is an instructional video where a pointer – whose location is fixed by gaze data – is used to show exactly where the expert is looking while they are solving a problem, with the goal of teaching that skill. Such modelling, that is, observation of expert problem solving is intended to help learners achieve joint attention with the model (usually an expert) and thereby improve information processing. Multiple studies have shown that EMMEs improve learner attention, i.e., resulting in faster, longer, and more frequent attention to task relevant elements, which in turn leads to increased learning performance (for a meta-analysis, see Xie et al., 2021). Outside of modelling examples, the use of eye gaze displays to provide attentional guidance can be seen in general multimedia instruction, where it’s used to perform the role of a laser pointer for establishing joint attention with the presenter (Sung, G., Feng, T., & Schneider, B., 2021; D'Angelo, S., & Schneider, B., 2021). Additionally, it was expected that eye gaze displays would enhance modelling by allowing a learner to observe problem-solving processes that are covert or absent in verbal explanations or actions of the expert. This aspect has been successfully demonstrated with EMMEs designed for non-procedural classification problems (Jarodzka et al., 2010, 2012, 2013) and multimedia comprehension tasks where learners modelled expert behaviour of text-image integration (Kerbs et al., 2019, Mason et al., 2015, 2017). However, for procedural problems there is little evidence that EMMEs offer any benefit beyond attentional guidance (Chisari et al., 2020, van Marlen et al., 2016, Noord, S. V., 2016, van Gog et al., 2009). As concluded by such studies, this could either mean that eye gaze displays were made redundant by expert verbalisations, or indicate the absence of processes that can be learned solely by observing an eye gaze display. This raises the question of whether there is more to what eye gaze displays can offer or if it is simply a matter of narrowing down the conditions under which EMMEs are effective (Tunga & Cagiltay, 2023).
We believe there exists untapped potential in eye gaze displays if the affordance of only making attention observable is extended to the affordance of making cognitive processes interpretable. This affordance originates from the eye mind hypothesis (Just & Carpenter, 1984, 1980) according to which there is an average to good association between a person’s gaze and conscious thought. While it has been suggested that the eye-mind hypothesis is weak and limited for certain tasks (Anderson et al., 2004), recent research on eye gaze displays highlights their ability to make the intentions and processes of a person interpretable (Emhardt et al., 2020; Foulsham & Lock, 2015; van Wermeskerken et al., 2018; Zelinsky et al., 2013). Furthermore, the domain-specific validity of the eye-mind hypothesis indicates that even if the association is not universally true, there could be specific domains (e.g. geometry problems) where it is sufficiently valid (Schindler & Lilienthal, 2019). Therefore, in domains and problems where eye gaze displays are reasonably interpretable, the comprehension of a problem solver's eye gaze display (hereafter referred to as the ‘model’ and used in an expertise-agnostic sense) whilst performing a task has the potential to become a meaningful meta-task for another problem solver (hereafter referred to as the ‘learner’). This possibility arises from the fact that the interpretation of an eye gaze display is firmly rooted in the contextual information intrinsic to the given problem-solving task (Kok & Jarodzka, 2017).
In this position paper, we explore and demonstrate the possibility of creating such meta-tasks, or eye gaze interpretation (EGI) tasks, for a spectral graph problem. The EGI task will use a model’s eye gaze display to pose questions about the problem solving processes of the model. Therefore, the EGI problem is in essence a problem about a problem, i.e., a meta-problem and we create such tasks by problematizing the problem solving process as stated in the title. We will simplify the domain-specificity of the problem to the extent possible for our general audience. We discuss a pilot demonstration of creating such EGI tasks using the eye gaze data of two models solving one spectral graph problem. We will create seven EGI tasks and discuss their pedagogical possibilities. Section 2 discusses the theoretical framing of EGI tasks.
Section 3 provides a conceptual framework for such tasks. Section 4 discusses the experimental setup used for the development of EGI tasks. Section 5 discusses the eye gaze data and the EGI tasks generated thereof. Section 6 discusses the scope of the tasks, followed by Section 7, which discusses the limitations of the pilot demonstration and outlines future work.
The theoretical positioning of EGI tasks is best understood in terms of the potential perceptual processes they elicit, such as what information receives attention, how they are organised, and interpreted. Perceptual learning can be defined as ‘an increase in the ability to extract information from the environment, as a result of experience and practice with stimulation coming from it’ (Gibson, 1969). Even though perceptual learning applies to various problem solving scenarios, it is most significant to visual problem solving tasks, from which much of the early evidence for perceptual learning has been obtained (Kellman & Massey, 2013). The acquisition of expertise in visual problem solving tasks is best seen as perceptual learning that comprises the acquisition of various perceptual skills. This fact is well known in domains such as medical education or radiology where visual problems are of great significance and perceptual learning is achieved through repeated practice (Alexander et al., 2020; Guegan et al., 2021).
One part of perceptual learning is the low level perceptual processes such as the identification of visual objects, symbols, or space (Watanabe & Sasaki, 2015, Dosher & Lu 2017). As low level perceptual skills are mostly acquired through experience, novice learners benefit from perceptual support. For low level perceptual skills, much like the EMMEs, the EGI tasks also give perceptual support to novice learners. The perceptual support from eye gaze displays can reduce the demand for low level perceptual processes by drawing attention to relevant visual objects and improving visual search. From a cognitive load standpoint alone, EMMEs can be as good or even superior to EGI tasks in this regard by virtue of it being an example based learning approach (Merrienboer, 2013; Renkl, 2014). However, an EGI task adds to this experience because it goes beyond scaffolding of low level perceptual processing and gives structure to the visual information being processed.
In particular, the major benefits of EGI tasks are expected from the leveraging of high level perceptual processes like ‘noticing’. Noticing is defined as the process of actively selecting and interpreting relevant information in the environment, assuming that any given situation contains an infinite amount of information to be perceived (van Es & Sherin, 2002). It is important to note that noticing is not limited to being able to identify visually salient features or being able to pay attention to important elements of a problem. Instead, noticing is a perceptual process where a learner is able to notice elements of deeper concepts associated with a problem. Recent studies that attribute improved learning performance to naturally occurring instances of noticing in socio-cultural practices (Lobato et al., 2012) and the design of experimental tasks that support noticing (Chase et al., 2019) make it a significant perceptual process that allows learning to take place. The proposed EGI tasks can be expected to elicit noticing in learners about the conceptual relationships between various perceptual objects and the conceptual objects within the context of a problem solving situation. The eye gaze data of the EGI task is expected to draw attention to key elements of problem-solving and the task itself is supposed to make learners notice how the elements are related within the context of the problem. It is this latter affordance that makes EGI tasks novel and distinct from EMMEs.
The possibility of EGI tasks to offer perceptual support, and make learners notice interrelated domain concepts resemble the two complementary mechanisms used by Reiser (2004) to characterise learning in scaffolded problem solving environments. The first mechanism is that of structuring which allows a learner to interact with the problem in a systematic and meaningful manner without being overwhelmed by its complexity. The second mechanism is the problematization of critical domain concepts so that learners can spend sufficient attention engaging with such concepts. In a similar fashion, we can expect EGI tasks to support learning on two fronts. First, as a perceptual scaffold which reduces the perceptual complexity of the problem and structures the visual problem in terms of the problem solving paths or states of the model. For example, even in graph comprehension problems (Mitra et al., 2017), where learners have to synthesise information from the different axes and the problem statement, learners can fail to effectively select and organise relevant information. The eye gaze present in an EGI task will reduce the problem complexity by highlighting and sequencing the relevant information. This could provide significant scaffolding for tasks where the mere identification of visual objects or patterns may itself be challenging such as in ECG graph signatures or seismic charts. Second, by asking questions that require noticing of the underlying domain concepts, the learner is challenged to think beyond what is required from the original problem on which the EGI task is based. For example, in a study by Mitra et al. (2017), successful learners solving a graph comprehension problem were found to dwell on the ‘conversion factor’ longer than others. An EGI task designed for this problem would inquire about why successful learners spend more time on the conversion factor, prompting the learner to truly recognise the role of the ‘conversion factor’ in solving the problem.
Finally, the unique pedagogical potential of EGI lies in the ‘meta’ nature of the task. The learner is expected to interpret the thoughts of the model by using their knowledge of the task and the eye gaze display of the model. While metacognition is a term used for cognition of one’s own cognition, Flavell’s (1979) original definition happens to be more inclusive and one that we intend to use here. Flavell (1979) proposed that metacognitive knowledge extended beyond the person as “the person category encompasses everything that you could come to believe about the nature of yourself and other people as cognitive processors.” Instructional designs that foster metacognition tend to focus on learners being metacognitive about their own cognition and is a coveted learning outcome in any type of learning (Berardi-Coletta et al., 1995; Mayer, 1998; Rickey & Stacy, 2000; Schoenfeld, 2016). Therefore, EGI tasks, which are essentially meta-tasks, could nudge learners to be metacognitive about the problem-solving processes of others, which is expected to improve learning outcomes as well.
We describe the concept of an EGI task using four hypothetical gaze displays (M1, M2, M3, and M4) for a geometry problem of parallel lines. The geometry problem (shown in Fig. 1) consists of identifying if the two red lines are parallel based on the intersecting angles they make with a common transversal. Fig. 1 shows the hypothetical eye gaze pattern (represented as sequentially numbered circles for fixations and arrows for saccades) of four models, who arrived at the right answer to the geometry problem (i.e., the red lines are not parallel). A plausible EGI task for these eye gaze displays would be to interpret the problem-solving logic of the model (i.e., the axioms and theorems applied by the model), assuming that the model solved the problem successfully. We shall use this EGI task as an example to understand how different models map to the aforementioned conceptual representation of EGI tasks.
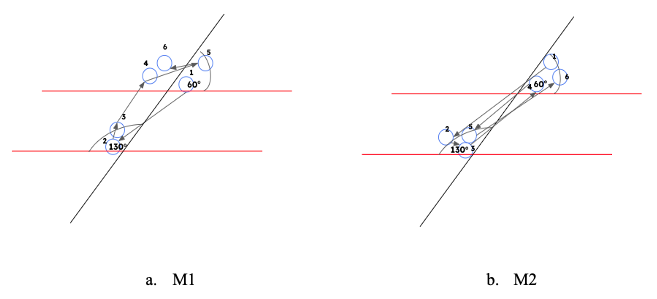
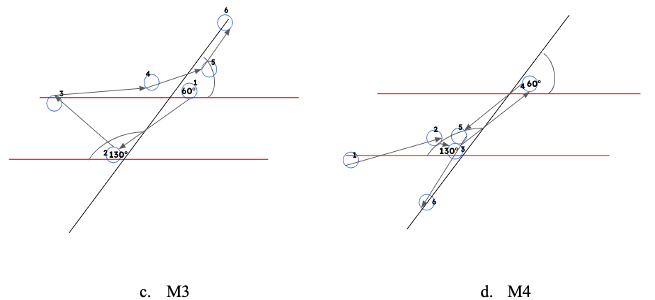
Figure 1. Hypothetical eye gaze displays of four models (M1, M2, M3, and M4) solving a geometry problem. (a) M1: Higher process interpretability and lower task relevant knowledge. (b) M2: Higher process interpretability and higher task relevant knowledge. (c) M3: Lower process interpretability and lower task relevant knowledge. (d) M4: Lower process interpretability and higher task relevant knowledge.
The hypothetical gaze models vary in terms of the interpretability of both the eye gaze display and the model's problem-solving process. Interpretability of a gaze display can be understood as the degree to which the problem-solving process is reflected in the gaze display. In this context, interpretability is higher in M1 and M2 compared to M3 and M4, respectively. The reduced interpretability of the process in M3 and M4 results from the presence of stray gaze patterns that lack meaningful relevance to the tasks at hand. The problem solving process of M1 is similar to M3 and M2 is similar to M4. Interpreting each of these models requires a different level of task relevant knowledge that can be characterised based on the axioms and theorems of line geometry as discussed below.
The relevant knowledge associated with the EGI task can be grouped into three levels, which are theorems of intersecting lines, axioms of parallel lines, and combined insights from these theorems and axioms. At the first level, we have theorems of intersecting lines, consisting of the vertical angles theorem and the adjacent angles theorem (vertically opposite angles are equal and adjacent angles are supplementary). At the second level, we have axioms of parallel lines, consisting of the corresponding angle axiom, alternate angle axiom and interior angle axiom (corresponding angles are equal, alternate angles are equal, and interior angles are supplementary). In addition to this, the third level consists of the insights about the intersecting lines that are obtained from combining these axioms and theorems and are beyond the immediate application of either of them. Hence, we can operationalize the task relevant knowledge axis for the EGI task to have 3 levels, in the increasing order of theorems of intersecting lines, axioms of parallel lines and insights from a combination of the theorems and axioms.
The problem solving process of M1 and M3 can be interpreted as a sequential application of the domain knowledge components (specifically alternate angle axiom and adjacent angle theorem). The sequence of eye gaze fixations and the information present in those areas are collectively interpreted to infer the problem solving process. However, interpreting the problem solving process of M2 and M4 will require knowledge beyond that of the individual axioms and theorems, i.e., the two given angles should add to 180o; demanding a synthesis of the theorem of intersecting lines and the axiom of parallel lines. A learner who can make an accurate interpretation can be said to have displayed a comprehensive understanding of the respective theorems and axioms.
Now we shall conceptualise EGI tasks in terms of the general factors that are involved in interpreting an eye gaze display. Interpretation of an EGI task is dependent on the interpretability of eye gaze display and the learner’s task relevant knowledge (which includes domain concepts and task understanding). Hence, all EGI tasks can be conceptually represented in terms of two mutually orthogonal factors; interpretability and task relevant knowledge (as shown in Fig. 2). The x-axis in the figure represents the amount of task relevant knowledge of a learner solving the EGI task. The y-axis represents the interpretability of the eye gaze display that is being used to create an EGI task. We conceive the interpretability of a gaze display as being based on the capture of several task-related attributes and the solution processes. A highly interpretable gaze display would have minimal erratic or task-irrelevant eye movements and would be mostly free of task-independent information. The y-axis intercept at (a) denotes the minimum level of interpretability required to create an EGI task, as beneath this level, the model processes pertaining to the task are not interpretable from the eye gaze display. The y-axis intercept at (b) denotes the level of interpretability beyond which an EGI task is trivial, as there is no need for any interpretation as the process is directly observable. While it's uncommon for a gaze display of a problem-solving task to fully convey the model's process without any interpretation, such gaze displays are highly suitable for EMMEs when it comes to communicating the model's processes to learners. This is because learners can readily understand these gaze patterns without significant interpretation. These gaze patterns are ideal for EMMEs, especially when gaze data is the sole source of process information. For instance, studies by Mason et al. in 2015 and 2016 demonstrated that students extracted critical aspects of the model's behaviour from eye movements alone, without any external explanations or prompts. In addition to this, we can also conceive an x-axis intercept at (c), to represent the minimum amount of task relevant knowledge required to engage with a non-trivial EGI task, and a y-axis intercept (d) to denote the total amount of task relevant knowledge needed to solve the EGI task. All possible instances of learners solving EGI tasks generated from a specific problem solving task can be denoted by the space bounding the four intercepts (a, b, c, and d).
We hypothesise that the ability to interpret a gaze display with lower interpretability will depend on their task relevant knowledge. We expect the higher levels of task relevant knowledge to aid in the abstraction of process information and ignoring task irrelevant gaze patterns. As a corollary, the EGI tasks of gaze displays with high interpretability are suited for learners with lower task-related knowledge. The green triangle has been used to conceptualise this inverse relationship. It denotes a set of EGI tasks that is suitable (solvable) for various learners in the expert-novice spectrum, possessing different amounts of task relevant knowledge. The triangle is only representative of the inverse relationship and does not imply a linear nature of any kind.
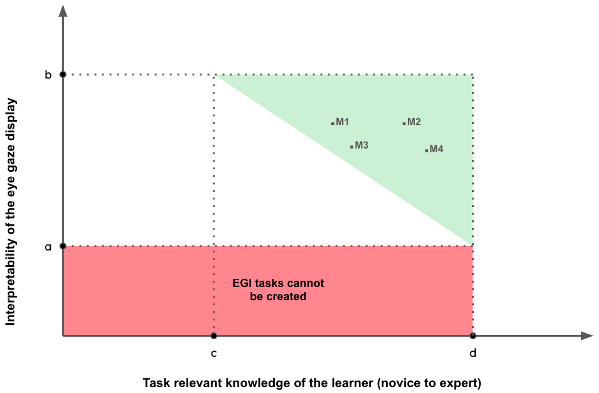
Figure 2. A conceptual representation of EGI tasks. (a) Minimum level of interpretability required to frame an EGI task. (b) Eye gaze display becomes trivial to interpret (c) Minimum amount of task relevant knowledge required to solve an EGI task. (d) The total task relevant knowledge associated with a task. M1, M2, M3, and M4 represent the conceptual examples of EGI tasks discussed in section 3.2.
We chose spectral graph problems to develop EGI tasks. A spectral graph problem can be seen as a type of puzzle where scientists use a graph to figure out the arrangement of atoms in a substance. The graph shows peaks and valleys (Fig. 4), each representing a frequency of radio waves absorbed and emitted by the atoms. By analysing the position and shape of the peaks, scientists can deduce the structure of the substance. It's like solving a puzzle where each peak represents a clue that needs to be put together to reveal the final picture. This technique is widely used in chemistry to determine the molecular structure of substances. Besides the domain-specific relevance, we chose spectral problems to create EGI tasks as its solution requires continual visual processing and the visual information has good spatial spread.
Our study consisted of two chemistry postgraduate students who solved four spectral graph problems in succession. They were provided with a graphic tablet to scribble or make markings while solving the problem. The eye gaze data of the participants were captured using a Tobii pro-x120 eye tracker (Tobii Pro AB, 2014) and iMotions software (iMotions, 2021). The study design consisted of collecting eye gaze models, creating EGI tasks from interpretable segments of the eye gaze models and then having the models retrospectively interpret each other’s gaze patterns to evaluate the validity of the interpretable segments identified and the corresponding EGI tasks (Fig. 3). The study was approved by the local institutional ethics committee (No. IITB-IEC/2019/012) and both the participants provided informed written consent.
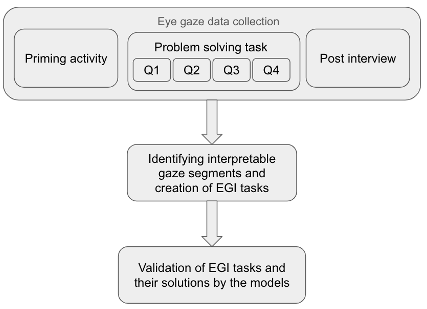
Figure 3. Study design
Prior to solving the spectral graph problems, participants engaged in a priming activity that featured a quiz to facilitate active recall of relevant domain concepts. They were also granted access to cheat sheets pertinent to solving the spectral problems. The priming activity was done so that the participants understood the nature of the problem solving activity and got accustomed to using the graphic tablet in the problem solving interface. The spectral graphs were obtained from the open access repository Spectral Zoo (Muzyka, 2021) and were sequenced in increasing order of difficulty. Even though the participants attempted 4 spectral problems, the EGI tasks from the first problem (Q1) alone are presented in this paper. As this is an exploratory position paper, this truncation of data is unproblematic. The eye gaze displays (video of eye gaze overlaid on the problem solving interface) were inspected to identify interpretable eye gaze segments and were used to frame EGI tasks. The participants solved the EGI tasks on a later date to partly validate that the gaze segments are interpretable and have meaningful interpretations.
In this section, we discuss the EGI tasks created from the eye gaze data of models P1 and P2 solving the spectral graph problem. We briefly describe the spectral graph problem and then describe the problem solving process of both models along with the eye movement displays that were used to create the EGI tasks. Lastly, we list the EGI tasks generated and discuss their pedagogical implications.
The NMR spectral graph problem is a key technique in organic chemistry used to determine the arrangement of atoms in a substance. Decoding a spectral graph requires the study of a graph that displays peaks and valleys, each representing different frequencies of radio waves. Each peak and valley of a spectral graph corresponds to a piece of information that must be assembled to deduce the molecular structure of an organic compound. A spectral graph (in Fig. 4) is solved by piecing together the inferences made from the position (i.e. the x coordinate) and the shape (i.e. the number of vertical lines making a peak) of the signals (marked A, B, and C in Fig. 4), to deduce the molecular structure. The position of a signal is read from its relative x-coordinate, which is indicative of the electronegative nature of the corresponding component of the molecule. The shape of a signal refers to the splitting pattern (no. of peaks in each signal) and the relative height of each peak. The shape gives information regarding the hydrogen atoms present in the substance. For a detailed and accurate description of the spectral graph and the solution to the specific spectral graph please refer to the appendix.
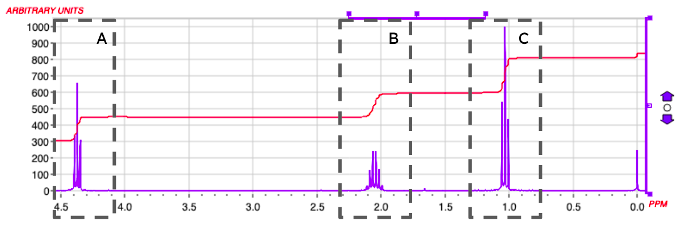
Figure 4. A spectral graph. Image from Spectral Zoo (Muzyka, 2021)
Here we describe the eye gaze patterns of models P1 and P2 using scan path diagrams (as in Fig. 5 & Fig. 6). The scan path diagram consists of gaze fixation bubbles connected by lines of gaze saccades. The numerical values on each fixation bubble denote the fixation sequence. The different signals in the spectral graph shall be referred to as signals A, B, and C as described in Fig. 4. Gaze model representations for longer segments can become crowded. Therefore, we recommend that readers refer to the eye gaze display videos of P1 and P2 (John, 2022a, 2022b). Also, note that the static scan paths are presented only for the sake of describing the eye gaze models to the reader as EGI tasks would rarely use static scan paths. Instead short video showing the temporal evolution of scan paths is a precondition for such tasks.
5.2.1 Eye gaze pattern of P1
P1 was successful in solving the spectral graph and arrived at the solution within 45 seconds of inspecting the spectra. P1 started inspecting the spectra from the left side. He fixated on the signal A, and then at the signal B. His gaze then moved past the signal C. This was followed by fixating on the molecular formula of the compound. The scan path plot corresponding to P1’s initial inspection is shown in Fig. 5a. This was followed by fixating on the signal C, and a quick scan of individual signals before writing the solution to the spectra on the white space on the right (Fig. 5b, right panel). The scan path up to the writing of the solution is shown in Fig. 5b. P1 spent a total of 38 seconds to arrive at the final answer. The eye gaze display of P1 can be accessed from (John, 2022a).
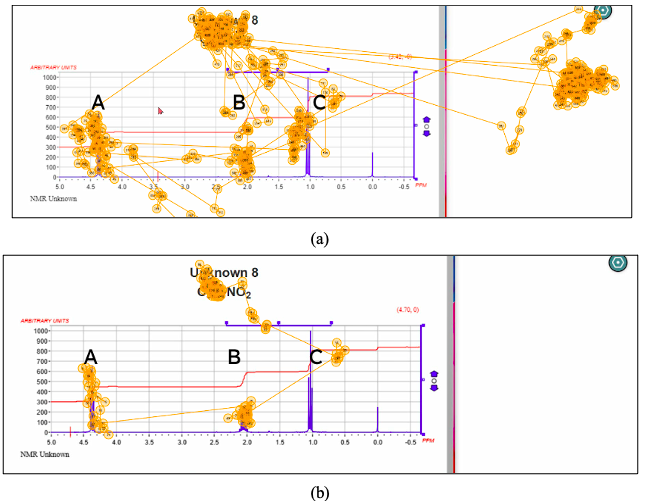
Figure 5. Scan path of P1 relevant to EGI tasks. The three signals have been marked as A, B and C for ease of readability.
5.2.2 Eye gaze pattern of P2
P2 was unsuccessful in solving the spectral graph problem. The model began by carefully inspecting and decoding the splitting patterns of each signal, following the corresponding scan path. (Fig. 6a). P2 then created four partial structures (Fig. 7a, 7b, 7c and 7d) before settling on the wrong answer (Fig. 7e). Partial structures are partly formed answers made by P2 at different instances. P2 had wrongly marked signal B as a septet (i.e. he identified signal B to have 7 splits) during his initial inspection of the spectra and corrected it to a sextet (i.e. a signal of six splits) when working on the first partial structure (Fig. 7a). The gaze pattern pertaining to this can be seen in Fig. 7b. P2 deleted it and proceeded to create the next partial structure (Fig. 7b) which was similar to the earlier one and was very close to the correct solution. The gaze pattern of this segment (Fig. 6c) shows P2 making adjustments to the partial structure based on the information from the entire spectra. Just before he abandoned the third partial structure (Fig. 7c), with gaze focused on signal A and the nitrogen atom on the molecular formula (Fig. 6d). P2 then moved on to another partial structure (Fig. 7c), this time without paying much attention to the spectral information (Fig. 6e), and realised that it was very far off from the solution (moved on from it within 10 seconds). Further, he tried one more partial structure (Fig. 7d) by focusing primarily on signal C and signal B areas of the spectra as depicted in (Fig. 6f). Then he arrived at this final structure (Fig. 7e) focused on the previously partial structure (Fig. 7d) as depicted in (Fig. 6g) P2 spent a total of 8 minutes 35 seconds to arrive at the final answer. The eye gaze displays of P2 can be accessed from (John, 2022b)
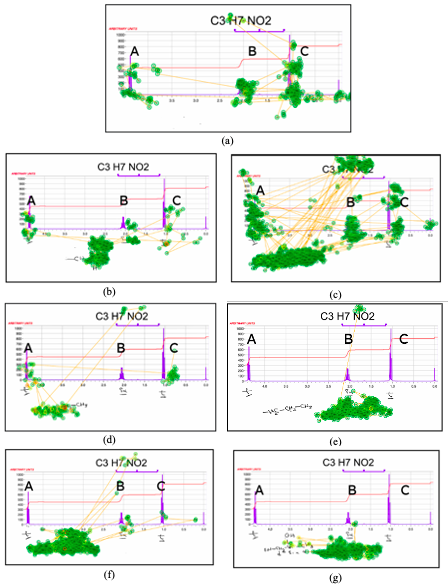
Figure 6. Scan paths of P2 that are relevant for creating EGI tasks. a. Scan path from the initial inspection of spectral graph. b. First partial structure. c. Second partial structure. d. Second partial structure (end segment) e. Third partial structure. f. Fourth partial structure. g. Final answer. The three signals have been marked as A, B, and C for ease of readability.
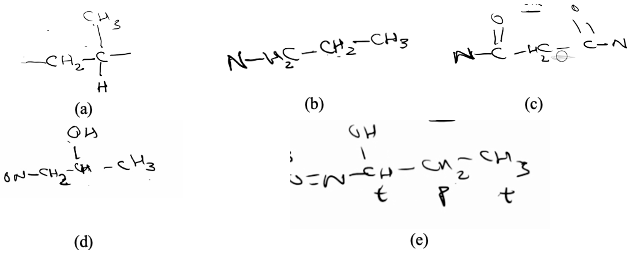
Figure 7. Partial structures formed by P2 at different instances. a. First partial structure. b. Second partial structure. c. Third partial structure. d. Fourth partial structure. e. Final answer.
We were able to create two broad EGI tasks (T1 and T2 in Table 1) from the eye gaze of models P1 and P2. These tasks require the entire gaze data of the respective models to be interpreted. P1 was a successful model that used the minimum amount of information from the spectral graph (the no. of signals and the no. of carbon atoms) and hence the EGI task was to deduce his problem solving logic (T1). In the case of P2 who was unsuccessful, the EGI task was to uncover the reason for this failure (T2). Interpreting the reason for P2 is possible because the gaze patterns reveal the segments of spectral information that he used at different stages of problem solving and pertaining to different partial structures. In addition to these broad EGI tasks, we were also able to create EGI tasks that are specific to particular gaze segments of model P2 (see tasks T2a, T2b, T2c, and T2d in Table 1) and an EGI task comparing the gaze segments of initial inspection of P1 and P2 (see tasks T1a in table 1). These tasks could be used to aid a learner who is not able to solve the broad EGI tasks and can be framed as objective multiple-choice questions as shown in Table 1. Since broad EGI task T2 requires the learner to inspect a long gaze model, the specific EGI tasks (T2a, T2b, T2c, and T2d) could guide them to notice specific instances, make interpretations and then collectively arrive at the solution.
The solutions to all the EGI tasks were validated by both models, by independently arriving at the same interpretations as the author. Both the models performed a retrospective evaluation of either of their gaze patterns guided by the EGI tasks. The models attempted the EGI tasks in the same sequence (T1, T1a, T2a, T2b, T2c, T2d, T2), where the solution of EGI task T2 was aided by first answering T2a, T2b, T2c and T2d. Next, we discuss the pedagogical value of the seven EGI tasks created in this study.
Table 1
EGI tasks created from gaze models of models P1 and P2
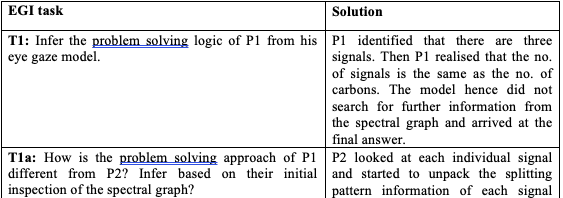
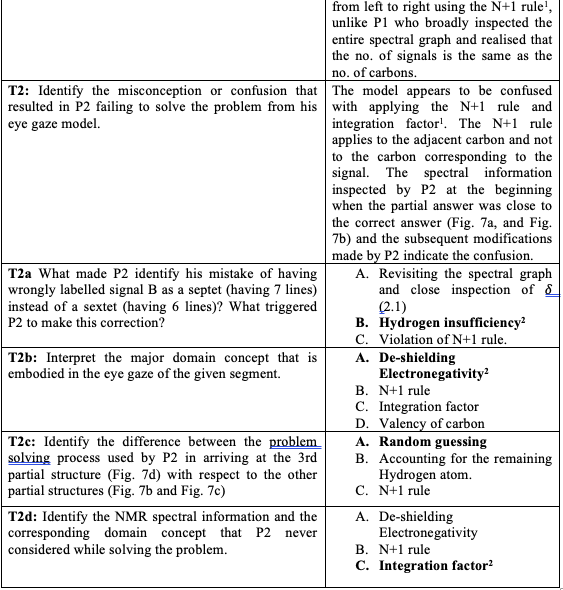
The EGI tasks T1 and T1a allow a learner to notice the hierarchy of information that is relevant to solving the NMR problem. T1a contrasts the problem solving approach of model P2 with the successful model P1, where P2 has failed to realise the basic information present in the no. of signals and no. of carbons. This was the most elementary piece of information needed to arrive at the correct solution. These EGI tasks may also be helpful in realising the need for being systematic when considering the spectral information and choosing the appropriate strategy suitable to the problem.
It’s also interesting to note that regardless of the model’s problem solving success or failure, the eye gaze display can still yield valuable insights about the problem solving process and hence be suitable for EGI task generation. For example, even though T2b was created from the unsuccessful model P2, it contained an interpretable gaze segment that clearly captured the elements pertaining to a domain concept (i.e. de-shielding electronegativity). The EGI tasks generated from model P2 (i.e. T2, T2a, T2c and T2d) also reveal to a learner major misconceptions or confusions that could arise in the process of problem solving. They also highlight the inefficiency of problem solving strategies (random assembly of atoms to satisfy the molecular formula) that a learner might opt for when not able to combine two pieces of spectral information. This attribute is somewhat underutilised in conventional instructional approaches, as they are primarily designed to support novices to learn from successful (or expert) models alone.
EGI tasks T1a and T2c could allow learners to compare problem solving processes and the contrasting cases and thereby understand varied perspectives of different problem solvers. Such perspective taking might be particularly valuable if the learner is an instructor or teacher who is expected to provide feedback or scaffold other learners.
Hence, EGI tasks seem to indicate a novel possibility for engaging learners with deeper and tacit components associated with the problem solving processes. As demonstrated, they can allow reflection on cognitive processes of problem-solving that go beyond their own and those of their immediate peers.
This work is an early-stage conceptualization and demonstration of EGI tasks that explore their pedagogical potential in visual problem solving. The pilot demonstration shows that EGI tasks can allow learners to interact with various elements of the problem solving processes such as choice of problem solving strategy, the influence of misconceptions or lack of concept clarity, and consequences of inefficient problem solving tactics. These elements extend beyond the domain knowledge components typically encountered during conventional learning activities involving instruction or problem solving. Consequently, EGI tasks could be regarded as a promising tool to foster a deeper understanding of the interactions among domain concepts, knowledge of problem-solving strategies, and misconceptions.
Our conceptualization of EGI tasks for a specific problem solving task is based on the interpretability of gaze display and the learner’s task relevant knowledge. However, when considering EGI tasks across the space of all possible visual problems, a key determinant of the nature and value of an EGI task is going to be the type of visual representation that is required to solve the root problem. Hence, a brief description of the variations that exist amongst visual representation tasks in the STEM fields and their relevance vis-a-vis EGI task creation can set the stage for understanding the true scope of EGI tasks.
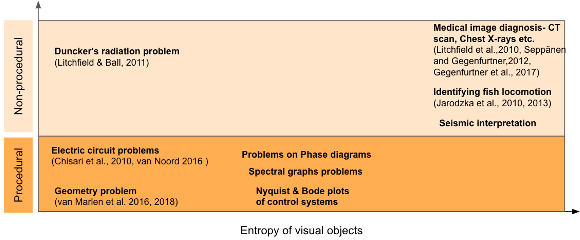
Figure 8. Mapping visual problems based on the entropy of visual objects and their procedural nature. The citations correspond to visual problem solving tasks for which EMME studies exist.
We have mapped common visual problems studied in STEM fields, focusing on two parameters we consider critical in the context of eye movements and visual problem-solving (as shown in Fig. 8). While the above mapping is by no means exhaustive, it aids in the discussion of EGI tasks beyond the limited scope of the examples presented in this paper. First, we consider the entropy of visual objects in the visual representation corresponding to the problem solving task. We borrow the term entropy from Shannon’s information theory (1948) as a measure of the amount of information present in a visual representation being used in a problem. In tasks with higher entropy of visual objects, the requirements for perceptual processing can be assumed to be larger. For such tasks identifying or noticing a salient visual object itself can become critical to the problem solving process, and hence lead to eye gaze patterns that are less interpretable. This is so because the model's perception of visual objects can be ambiguous and not interpretable from the eye gaze data alone. Second, we consider a binary classification based on the procedural nature of the task (procedural vs. non-procedural); where the procedural tasks are those that require some set of transformations to be performed on the information present in the visual form. This classification is also present in the EMME literature and has been found to be a differentiator in the effectiveness of EMMEs, with them being ineffective for non-procedural tasks (van Marlen et al., 2016; Xie et al., 2021). They both have different advantages in the context of designing EGI tasks. The benefit of using non-procedural tasks is that most (if not all) of the problem solving process is perceptual and hence a significant amount of the process is captured within the gaze patterns. The benefit of using procedural tasks is that they create partial solutions or artefacts during the problem solving process; which if captured (through screen recording or graphic inputs etc.) can provide more contextual information for gaze interpretation (as seen with the partial structures of molecules in the above case study).
This work is an early stage conceptualisation and therefore has some inherent limitations. One major limitation is the absence of validation of these tasks with actual learners. Thus, future work should characterise learner interactions and performance with EGI tasks to validate the hypothesised benefits. Another limitation is that we have not assessed the efficiency and effectiveness of EGI tasks in terms of time and resource requirements compared to alternative methods like direct instruction or guided practice for supporting learners' problem-solving.
Moreover, our choice of spectral graph problems to create EGI tasks was guided by their inherent characteristic of having task relevant information evenly distributed across the display. This characteristic reduces the likelihood of violating the eye-mind assumption due to factors like para-foveal vision or ambiguity about the attended information at any given moment. Nevertheless, it's important to acknowledge that the creation of EGI tasks may be susceptible to the limited validity of the eye-mind hypothesis (Anderson, 2004; Kok & Jarodzka, 2017). This is a valid concern and warrants further investigation. However, we are fairly optimistic about the applicability of a reasonably strong eye-mind hypothesis in domain-specific problems like the spectral graph problem, as has been shown by some researchers (Schindler & Lilienthal, 2019; Wu & Liu 2022). There is, however, a need to improve the methodological reliability of identifying interpretable segments within a broader dataset.
In addition to the pedagogical possibilities discussed in this paper, we also anticipate an assessment potential from our conceptualisation (Fig. 1) of the inverse relation between the interpretability of an eye gaze display and the task relevant knowledge needed to interpret such a display. Such assessment, if possible, could probe knowledge elements beyond domain concepts that are tested in conventional assessments, like that of strategies and latent concepts related to a problem solving task. This possibility shall be explored in future work, with a battery of validated and reliable EGI tasks.
We acknowledge the role of two anonymous reviewers and the Editor-in-Chief, Prof. Nina B. Dohn, for providing detailed feedback which greatly improved the quality of the manuscript. We also extend our gratitude to Mr. Amrit Pal Singh for help with proofreading of the manuscript. This work was supported by an IIT Bombay internal research grant, RD/0517-IRCCSH0-001, to Ritayan Mitra.
1Detailed descriptions of the rules and concepts related to the spectral graph are provided in the appendix.
2EGI tasks T2a, T2b, T2c and T2d being MCQs their solutions are indicated in bold text.
Alexander, R. G., Waite, S., Macknik, S. L., & Martinez-Conde, S.
(2020). What do radiologists look for? Advances and limitations of
perceptual learning in radiologic search. Journal of Vision, 20(10), 17-17.
https://doi.org/10.1167/jov.20.10.17
Anderson, J. R., Bothell, D., & Douglass, S. (2004). Eye movements do
not reflect retrieval processes: Limits of the eye-mind hypothesis.
Psychological Science, 15(4), 225-231.
https://doi.org/10.1111/j.0956-7976.2004.00656.x
Berardi-Coletta, B., Buyer, L. S., Dominowski, R. L., & Rellinger, E. R.
(1995). Metacognition and problem solving: A process-oriented approach.
Journal of Experimental Psychology: Learning, Memory, and Cognition, 21(1),
205.
https://doi.org/10.1037/0278-7393.21.1.205
Chase, C. C., Malkiewich, L., & S Kumar, A. (2019). Learning to notice
science concepts in engineering activities and transfer situations. Science
Education, 103(2), 440-471.
https://doi.org/10.1002/sce.21496
Chiu, M.-H. (Ed.). (2016). Science Education Research and Practices in
Taiwan. Springer Singapore.
https://doi.org/10.1007/978-981-287-472-6
Dosher, B., & Lu, Z. L. (2017). Visual perceptual learning and models.
Annual review of vision science, 3, 343.
Emhardt, S. N., Wermeskerken, M., Scheiter, K., & Gog, T. (2020).
Inferring task performance and confidence from displays of eye movements.
Applied Cognitive Psychology, 34(6), 1430–1443.
https://doi.org/10.1002/acp.3721
Flavell, J. H. (1979). Metacognition and cognitive monitoring: A new area of
cognitive–developmental inquiry. American psychologist, 34(10), 906.
https://doi.org/10.1037/0003-066x.34.10.906
Foulsham, T., & Lock, M. (2015). How the Eyes Tell Lies: Social Gaze
During a Preference Task. Cognitive Science, 39(7), 1704–1726.
https://doi.org/10.1111/cogs.12211
Gibson, E. J. (1969). Principles of perceptual learning and development.
https://doi.org/10.2307/1572721
Guegan, S., Steichen, O., & Soria, A. (2021, March). Literature review
of perceptual learning modules in medical education: What can we conclude
regarding dermatology?. In Annales de Dermatologie et de Vénéréologie (Vol.
148, No. 1, pp. 16-22). Elsevier Masson.
https://doi.org/10.1016/j.annder.2020.01.023
Helle, L. (2017). Prospects and Pitfalls in Combining Eye-Tracking Data and
Verbal Reports. Frontline Learning Research, 5(3), 1-12.
https://doi.org/10.14786/flr.v5i3.254
iMotions (9.1), iMotions A/S, Copenhagen, Denmark, (2021).
Jarodzka, H., Scheiter, K., Gerjets, P., & van Gog, T. (2010). In the
eyes of the beholder: How experts and novices interpret dynamic stimuli.
Learning and Instruction, 20(2), 146–154.
https://doi.org/10.1016/j.learninstruc.2009.02.019
Jarodzka, H., van Gog, T., Dorr, M., Scheiter, K., & Gerjets, P. (2013).
Learning to see: Guiding students’ attention via a Model’s eye movements
fosters learning. Learning and Instruction, 25, 62–70.
https://doi.org/10.1016/j.learninstruc.2012.11.004
John, David [EGI tasks]. (2022, May 13). P1- Nitropropane [Video]. YouTube.
https://www.youtube.com/watch?v=WfCFErB0v2k
John, David [EGI tasks]. (2022, May 13). P2 Nitropropane [Video]. YouTube.
https://www.youtube.com/watch?v=U5zWdUveR-c
Just, M. A., & Carpenter, P. A. (n.d.). A Theory of Reading: From Eye
Fixations to Comprehension. 26.
https://doi.org/10.4324/9780429505379-8
Kellman, P. J., & Massey, C. M. (2013). Perceptual learning, cognition,
and expertise. In Psychology of learning and motivation (Vol. 58, pp.
117-165). Academic Press.
https://doi.org/10.1016/b978-0-12-407237-4.00004-9
Kok, E. M., & Jarodzka, H. (2017). Before your very eyes: The value and
limitations of eye tracking in medical education. Medical Education, 51(1),
114–122.
https://doi.org/10.1111/medu.13066
Krebs, M. C., Schüler, A., & Scheiter, K. (2019). Just follow my eyes:
The influence of model-observer similarity on Eye Movement Modeling
Examples. Learning and Instruction, 61, 126-137.
https://doi.org/10.1016/j.learninstruc.2018.10.005
Litchfield, D., & Ball, L. J. (2011). Rapid communication: Using
another’s gaze as an explicit aid to insight problem solving. Quarterly
Journal of Experimental Psychology, 64(4), 649–656.
https://doi.org/10.1080/17470218.2011.558628
Lobato, J. (2012). The actor-oriented transfer perspective and its
contributions to educational research and practice. Educational
Psychologist, 47(3), 232-247.
https://doi.org/10.1080/00461520.2012.693353
Mason, L., Pluchino, P., & Tornatora, M. C. (2015). Eye-movement
modeling of integrative reading of an illustrated text: Effects on
processing and learning. Contemporary Educational Psychology, 41, 172–187.
https://doi.org/10.1016/j.cedpsych.2015.01.004
Mason, L., Pluchino, P., & Tornatora, M. C. (2016). Using eye‐tracking
technology as an indirect instruction tool to improve text and picture
processing and learning. British Journal of Educational Technology, 47(6),
1083-1095.
https://doi.org/10.1080/00461520.2012.693353
Mason, L., Scheiter, K., & Tornatora, M. C. (2017). Using eye movements
to model the sequence of text-picture processing for multimedia
comprehension: Using eye movements to model. Journal of Computer Assisted
Learning, 33(5), 443–460.
https://doi.org/10.1111/jcal.12191
Mayer, R. E. (1998). Cognitive, metacognitive, and motivational aspects of
problem solving. Instructional science, 26(1-2), 49-63.
https://doi.org/10.1007/978-94-017-2243-8_5
Mitra, R., McNeal, K. S., & Bondell, H. D. (2017). Pupillary response to
complex interdependent tasks: A cognitive-load theory perspective. Behavior
Research Methods, 49, 1905-1919.
https://doi.org/10.3758/s13428-016-0833-y
Muzyka, J. L. (2021). Spectral Zoo: Combined Spectroscopy Practice Problems
for Organic Chemistry. 12.
Rayner, K. (Ed.). (1992). Eye Movements and Visual Cognition: Scene
Perception and Reading. Springer New York.
https://doi.org/10.1007/978-1-4612-2852-3
Rayner, K. (2009). The 35th Sir Frederick Bartlett Lecture: Eye movements
and attention in reading, scene perception, and visual search. Quarterly
Journal of Experimental Psychology, 62(8), 1457–1506.
https://doi.org/10.1080/17470210902816461
Reiser, B. J. (2004). Scaffolding complex learning: The mechanisms of
structuring and problematizing student work. In The Journal of the Learning
sciences (pp. 273-304). Psychology Press.
https://doi.org/10.4324/9780203764411-2
Renkl, A. (2014). Toward an instructionally oriented theory of example based
learning. Cognitive science, 38(1), 1-37.
https://doi.org/10.1111/cogs.12086
Rickey, D., & Stacy, A. M. (2000). The role of metacognition in learning
chemistry. Journal of chemical education, 77(7), 915.
https://doi.org/10.1021/ed077p915
Schoenfeld, A. H. (2016). Learning to think mathematically: Problem solving,
metacognition, and sense making in mathematics (Reprint). Journal of
education, 196(2), 1-38.
https://doi.org/10.1177/002205741619600202
Schindler, M., & Lilienthal, A. J. (2019). Domain-specific
interpretation of eye tracking data: towards a refined use of the eye-mind
hypothesis for the field of geometry. Educational Studies in Mathematics,
101, 123-139.
https://doi.org/10.1007/s10649-019-9878-z
Shannon, C. E. (1948). A mathematical theory of communication. The Bell
system technical journal, 27(3), 379-423.
https://doi.org/10.1002/j.1538-7305.1948.tb01338.x
Thomas, L. E., & Lleras, A. (2007). Moving eyes and moving thought: On
the spatial compatibility between eye movements and cognition. Psychonomic
Bulletin & Review, 14(4), 663–668.
https://doi.org/10.3758/BF03196818
Tobii Pro, A. B. (2014). Tobii pro lab. Computer software. http://www.
tobiipro. com.
Tunga, Y., & Cagiltay, K. (2023). Looking through the model’s eye: A
systematic review of eye movement modeling example studies. Education and
Information Technologies, 1-27.
https://doi.org/10.1007/s10639-022-11569-5
Underwood, G., & Everatt, J. (1992). The Role of Eye Movements in
Reading: Some Limitations of the Eye-Mind Assumption. In Advances in
Psychology (Vol. 88, pp. 111–169). Elsevier.
https://doi.org/10.1016/S0166-4115(08)61744-6
Van Es, E. A., & Sherin, M. G. (2002). Learning to notice: Scaffolding
new teachers’ interpretations of classroom interactions. Journal of
technology and teacher education, 10(4), 571-596.
https://doi.org/10.1016/j.tate.2006.11.005
van Gog, T., Jarodzka, H., Scheiter, K., Gerjets, P., & Paas, F. (2009).
Attention guidance during example study via the model’s eye movements.
Computers in Human Behavior, 25(3), 785–791.
https://doi.org/10.1016/j.chb.2009.02.007
van Marlen, T., van Wermeskerken, M., Jarodzka, H., & van Gog, T.
(2016). Showing a model’s eye movements in examples does not improve
learning of problem-solving tasks. Computers in Human Behavior, 65, 448–459.
https://doi.org/10.1016/j.chb.2016.08.041
Van Merrienboer, J. J. (2013). Perspectives on problem solving and
instruction. Computers & Education, 64, 153-160.
https://doi.org/10.1016/j.compedu.2012.11.025
van Wermeskerken, M., Litchfield, D., & van Gog, T. (2018). What Am I
Looking at? Interpreting Dynamic and Static Gaze Displays. Cognitive
Science, 42(1), 220–252.
https://doi.org/10.1111/cogs.12484
Xie, H., Zhao, T., Deng, S., Peng, J., Wang, F., & Zhou, Z. (2021).
Using eye movement modelling examples to guide visual attention and foster
cognitive performance: A meta analysis. Journal of Computer Assisted
Learning, 37(4), 1194–1206.
https://doi.org/10.1111/jcal.12568
Watanabe, T., & Sasaki, Y. (2015). Perceptual learning: toward a
comprehensive theory. Annual review of psychology, 66, 197.
https://doi.org/10.1146/annurev-psych-010814-015214
Wu, C. J., & Liu, C. Y. (2022). Refined use of the eye-mind hypothesis
for scientific argumentation using multiple representations. Instructional
Science, 50(4), 551-569.
https://doi.org/10.1007/s11251-022-09581-w
Zelinsky, G. J., Peng, Y., & Samaras, D. (2013). Eye can read your mind:
Decoding gaze fixations to reveal categorical search targets. Journal of
Vision, 13(14), 10–10.
https://doi.org/10.1167/13.14.10
NMR spectral graph problem
NMR spectroscopy is an analytical technique used in chemistry to determine the arrangement of atoms in a substance. The technique involves analysing a graph called an NMR spectrum that shows peaks and valleys representing the different frequencies of radio waves absorbed and emitted by the atoms in the substance. This spectral graph problem requires analysing the position and shape of the signals in the spectrum to deduce the molecular structure. The position of a signal is read from its relative x-coordinate, which is indicative of the electronegative nature of the corresponding component of the molecule. The shape of a signal refers to the splitting pattern and relative height of each peak. Interpreting the pattern of peaks and valleys is like solving a puzzle, where each signal represents a piece of information that needs to be put together to solve the molecular structure.
Solution to the spectral graph of 1-Nitro-propane
Inferring the molecular structure of a compound (in this case C3H7NO2) from its H+NMR spectra (shown in Fig. 9) requires the participant to piece together three types of information from the spectral graph and they are as follows:
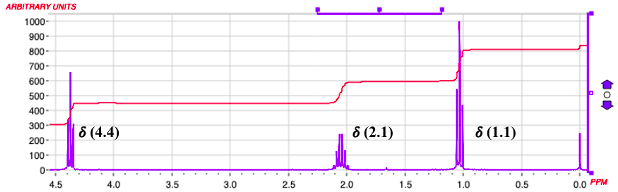
Figure 9. NMR spectra of 1-Nitropropane. Image from Spectral Zoo (Muzyka, 2021)
Each signal is referred to by ‘𝛿’ and the chemical shift value corresponding to the signal. The NMR spectra of 1-Nitropropane (Fig. 3) have three spectral signals, which can be represented using their chemical shift values as 𝛿 (4.4), 𝛿 (2.1) and 𝛿 (1.1) from left to right. The three unique spectral signals indicate the presence of three groups of chemically equivalent hydrogen. The ratios of the integral factors indicate that 𝛿 (4.4) and 𝛿 (2.1) have equal no. of hydrogen atoms while 𝛿 (1.1) correspond to larger no. of hydrogen atoms, with the integration factors revealing that 𝛿 (1.1) correspond to three hydrogen atoms and the other two signals correspond to two hydrogen atoms each. The splitting patterns of 𝛿 (4.4) and (1.1) can be seen to have three peaks (referred to as triplets), while 𝛿 (2.1) has six peaks (referred to as a sextet). The splitting pattern can be reasoned with a simplified version of the “N+1 rule”, according to which a signal with N+1 splits then the carbon corresponding to that signal will have “N” neighbouring hydrogen atoms. It is important to note that while the N+1 rule informs about the hydrogen in adjacent carbons, the integration factor corresponds to the no. of hydrogen in the carbon corresponding to a given signal.