![]()
Frontline Learning Research Vol.11 No. 2 (2023) 78 - 98
ISSN 2295-3159
aUniversity of Oulu, Finland
b Aalto University, Finland
cUniversity of Jyväskylä, Finland
Article received 21 April 2023/ revised 27 October 2023/ accepted 27 October 2023/ available online 6 December 2023
An in-depth understanding of student experiences and evaluations of learning analytics dashboards (LADs) is needed to develop supportive learning analytics tools. This study investigates how students (N = 140) evaluated two student-facing LADs as a support for academic path-level self-regulated learning (SRL) through the concrete processes of planning and monitoring studies. Aim of the study was to gain new understanding about student perspectives for LAD use on academic path-level context. The study specifically focused on the student evaluations of the dashboard support and challenges, and the differences of student evaluations based on their self-efficacy beliefs and resource management strategies. The findings revealed that students evaluated dashboard use helpful for their study planning and monitoring, while the challenge aspects mostly included further information needs and development ideas. Students with higher self-efficacy evaluated the dashboards as more helpful for study planning than those with lower self-efficacy, and students with lower help-seeking skills evaluated the dashboards as more helpful for study monitoring than those with higher help-seeking skills. The results indicate that the design of LAD can help students to focus on different aspects of study planning and monitoring and that students with different beliefs and capabilities might benefit from different LAD designs and use practices. The study provides theory-informed approach for investigating LAD use in academic path-level context and extends current understanding of students as users of LADs.
Keywords: Academic Paths; Learning-Analytics; Multiple-Case Study; Self-Regulated Learning; Student-Facing Dashboards
This study investigates how students evaluate two student-facing learning analytics dashboards (LADs) as a support for planning and monitoring their studies. LADs that are well-aligned with students’ needs hold the potential to support students by providing them actionable insights into their learning (Lim et al., 2020). However, what students report as relevant to see and use on dashboards often differs from what current LADs typically provide (Jivet et al., 2020; Viberg et al., 2020). Moreover, students’ perceptions and evaluations of the LAD feedback influence on their willingness to use such feedback productively (Schumacher & Ifenthaler, 2018). Therefore, there is a need to explore student evaluations and ideas of actionable feedback to develop LAD designs and LA use practices (Ochoa & Wise, 2021).
This study focuses on academic-path level perspectives of LA use, which means that learning is approached beyond the course level, focusing on the longer-term educational practices and processes such as study periods and academic years (e.g., Ludvigsen et al., 2011). Previous research on learning analytics (LA) has broadly focused on course-level LADs and their use as a support for SRL (Viberg et al., 2020). Also, studies have focused on the institutional aspects of academic-path level support, such as predicting students’ risk for drop out or providing insights for academic advising (Gutiérrez et al., 2018; Ifenthaler & Yau, 2020). The academic path perspective provides an important window to explore how HE students’ capacity as learners and future professionals unfolds over time (e.g., Lahn, 2011; Vanthornout et al., 2017). Academic paths involve many situations where students need to make different educational choices and decisions, including the selection of major and minor subjects, time management inside and outside of class, and eventually, what kind of career they wish to build (Khiat, 2019; White, 2015). Supporting students on their academic paths with LA becomes ever more important for HE institutions with increasing student intakes, pressure to graduate in given times and organizing education in distance and hybrid formats (Pelletier et al., 2022).
To be able to succeed in their learning with the increasingly complex, technology-rich environments of higher education, students need strong self-regulation skills (SRL; Jansen et al., 2020; Järvelä et al., 2011). Supporting SRL has been one of the major interests in the research of LADs (Matcha et al., 2019). However, current research has shown gaps in the ways support for SRL has been designed (Viberg et al., 2020). Studies have addressed the imbalance in supporting the phases of SRL. While some of the LADs focus the support on evaluation and reflection phases, the others emphasize more goal setting and planning phases of SRL (Heikkinen et al., 2023; Jivet et al., 2017; Viberg et al., 2020). However, all phases of SRL are important for a successful SRL process (Panadero, 2017). This study aims to deepen the current understanding of students’ perspectives on support provided for the SRL process via LADs. We investigate how students evaluate the support and challenge aspects of two LADs in terms of their SRL process.
Students’ success in self-regulated learning is influenced by multiple factors. Students’ motivational beliefs, such as self-efficacy beliefs, and their use of learning strategies have an interdependent relationship with the success of their SRL (Broadbent, 2017; Zimmerman, 2000). Students who have strong self-efficacy beliefs are likely to perform higher in academic achievement since they are more willing to approach challenging learning activities, put forth more effort and persist longer at difficult activities, and use SRL strategies more effectively compared to those students with weak self-efficacy beliefs (Schunk, 1991). Resource management strategies describe how students can utilize the resources available for their learning, such as elements in their learning environment, or asking help from teachers or their peers (Pintrich et al., 1991). Self-efficacy beliefs and resource management strategies can influence how students evaluate, interpret, and are able to utilize feedback provided via LADs (Aguilar & Baek, 2019; Rets et al., 2021). In this study, we investigate how students’ self-efficacy beliefs and resource management strategies are associated with their evaluations of the LAD support for their SRL.
This study applies a multiple-case design to explore students’ evaluations of the two LADs. The study aims to deepen existing understanding of how students articulate the support and challenge aspects of the two LADs in terms of their SRL. This will increase contextualized understanding of the user aspects for LAD design in the context of academic paths. Furthermore, this study analyzes the association between students’ self-efficacy beliefs and resource management strategies with student evaluations. This will deepen the existing understanding of the individual differences in students’ capacities to productively utilize the feedback provided via LADs.
SRL is defined as a continuous, cyclical process through which a student engages in making a strategic effort for learning (Winne, 2011). According to the SRL model of Winne and Hadwin (1998), SRL takes place through four linked phases 1) task understanding, 2) goal setting, 3) studying tactics, and 4) adaptation. The four phases are open and recursive, which means that they do not always unfold in the same order and that the work done in the earlier phases update the conditions in which students conduct their learning activities during the next cycle of regulation activity (Panadero, 2017; Winne & Hadwin, 1998). This model of SRL was selected in this study because on the academic-path level, students need to become aware, for example, of the rules and requirements of the different courses to be able to plan their studies. As compared with other SRL models, specific for Winne and Hadwin’s (1998) model of SRL is that the phases of task understanding and goal setting have been separated, which helps to formulate more specific ways of supporting SRL (Greene & Azevedo, 2007). Studies of LA design and student experiences have discussed the ways LADs support the phases of the SRL process (Heikkinen et al., 2023; Viberg et al., 2020). We investigate student perspectives for LAD use through the concrete processes of study planning and monitoring processes that contextualize and operationalize the four phases SRL process on an academic-path level. This offers a new theoretical approach in a context where LA has previously been typically developed in data- and practice-oriented ways (Mendez et al., 2021).
In Finnish higher education, study planning and monitoring processes are guided by the creation of a personal study plan (PSP) in the study information system. The purpose of the PSP is to help students make their educational choices, select their major- and minor subjects, and help advisors and students monitor and reflect on study progression throughout the academic paths. Thus, LADs discussed in this study focus on the study planning and monitoring processes with the data related to the PSP and study information system.
1.2.1 Study planning
The first two phases of SRL, namely context understanding and goal setting, are in a major role in the study planning process. The construction of the objects is necessary for coordination to take place and create order for the students so they can experience continuity in their academic paths (Ludvigsen et al., 2011).
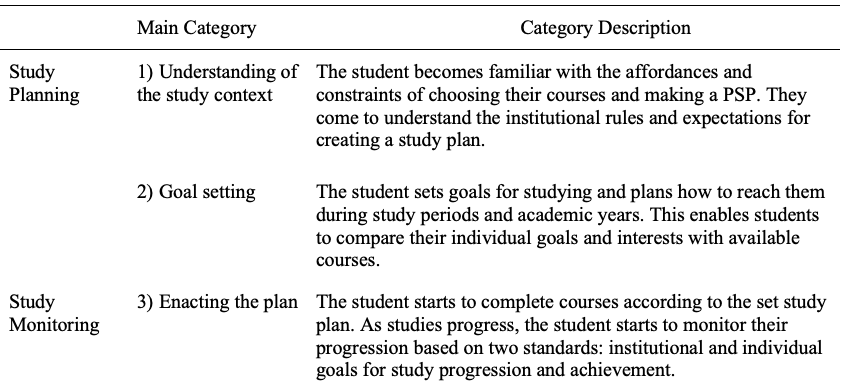
In the first phase, 1) understanding the study context, students become familiar with the affordances and constraints of making a personal study plan (PSPs) in their respective degree programs. Students have an opportunity to familiarize themselves with the goals and missions of an institution as well as the rationale and structure of the studies (White, 2015). Students formulate an understanding of their upcoming studies to set the overall objectives for conducting their degree. In the original model of Winne and Hadwin (1998), this is a task-understanding phase that explains how a student generates a perception about what the studying task is and what constraints and resources are in place.
In the second phase, 2) Goal setting and planning, students set goals for studying and plan how to reach them during study periods and academic years (Winne, 2011). Students have a chance to reflect on their individual interests, needs, and expectations regarding the available educational possibilities and constraints (White, 2015). In the original model of Winne and Hadwin (1998), this phase explains how a student generates goals and constructs a plan for addressing a study task.
1.2.2 Study monitoring
When students monitor their learning, they connect the historical aspects of learning with their present and formulate perceptions of their future academic paths (Ludvigsen et al., 2011). In the third phase of SRL, 3) Enacting the (study) plan, students use their PSPs to monitor their study progression in relation to their own and institutional goals, and to make necessary adaptations to their plans (Winne, 2011). Monitoring is crucial for students to continue reflecting the quality and relevance of the set plan (Winne, 2011). On academic-path level students typically focus on coordinating several courses and their learning goals in parallel, managing their time and available individual resources for studying. In the original model of Winne and Hadwin (1998), this phase is called enacting study tactics and strategies, and it describes how the plan of study tactics that was created is carried out.
The fourth phase, 4) Adaptation of the (study) plan describes how at chosen points in time, the entire plan may be evaluated. This is an important step to make adaptations such as setting more specific or different types of goals for following semesters, selecting different types of courses, or stretching the time used for their degree. In the original model of Winne and Hadwin (1998), the last phase is described as a large-scale adaptation, and it focuses on how students evaluate the entire approach that they selected to work on their task based on their overall experience of studying in the first three stages (Winne & Hadwin, 1998).
Self-efficacy is students’ motivational perception of their capabilities to succeed in upcoming learning processes and tasks and to achieve a desired outcome (Bandura, 1977; Schunk, 1991). Self-efficacy beliefs have a reciprocal influence on students’ SRL, such as their use of different learning strategies (Järvelä et al., 2011). Students who have strong self-efficacy beliefs are likely to perform higher in academic achievement since they are more willing to approach challenging learning activities, put forth more effort and persist longer at difficult activities, and use SRL strategies more effectively compared to those students with weak self-efficacy beliefs (Schunk, 1991). Students with higher self-efficacy beliefs are more capable in utilizing feedback to improve their learning strategies and outcomes (Li et al., 2022). Thus, it is expected in this study that students with higher self-efficacy beliefs provide more positive evaluations of LADs to support their SRL.
Knowledge of SRL strategies is an influential part of students’ SRL competence (Dresel et al., 2015). Resource management strategies include skills such as time management, and managing study environment, effort regulation such as prioritizing and planning one’s use of time, and help-seeking skills such as how well students engage in support-seeking strategies such as asking for help from others (Dresel et al., 2015). These strategies are highlighted beyond the course level when students control and coordinate their parallel learning processes throughout different contexts and assignments. Learners who are less fluent in self-regulating their learning, use more intensively actionable feedback about their learning (Tempelaar, 2019). Studies have also indicated that students with fluent SRL skills consider dashboard elements relevant to their learning (Jivet et al., 2020). Thus, it is expected that students with high resource management strategies provide more positive evaluations of LADs than students with low resource management strategies.
We ground the analysis of student evaluations with the four phases of SRL to explore how students perceive the dashboards supporting their study planning and monitoring on the academic path level. We focus on the student perspectives on LADs in authentic contexts through two cases where students were instructed to test the dashboards and to reflect on their experience. This study addresses the following research questions:
1) How did the students evaluate the LADs as a support for SRL phases?
2) What kind of challenges did the students identify in LADs in terms of support for SRL phases?
3) How were the students’ self-efficacy beliefs and resource management strategies associated with students’ experienced support or challenges?
We set the following hypotheses to study the association of self-efficacy beliefs and resource management strategies with student evaluations of the support and challenge aspects of the dashboards:
Hypothesis 1: Higher self-efficacy beliefs are associated with more positive evaluations of LADs to support the SRL on the academic path level.
Hypothesis 2: Higher resource management strategies are associated with more positive evaluations of LADs to support the SRL on the academic path level.
We applied a multiple-case design (Yin, 2009) to explore student evaluations of LADs. This enabled contextualized exploration of students’ LAD evaluations. In Finnish higher education, each student creates a personal study plan (PSP) that contains all courses and major and minor electives that they plan to include in their academic path. The PSP is used as a reflection tool for students and advisors to monitor and reflect the study progression through their PSPs.
The design of the two LADs were developed within a multidisciplinary project team including members from seven Finnish universities. The project focused on identifying essential aspects of legal, ethical, institutional, and pedagogical design and deployment of LA in HE institutions. The development process of student-facing LADs started by investigating students’ information and support needs (Silvola et al., 2021a). After that, the use of registry data was explored, and analysis methods for visualizing data were analyzed and evaluated within the development team. During the process, a multidisciplinary development team defined the criteria for the LAD design. At first, the usability and fluency of the use of LADs were investigated with students (Silvola et al., 2021b; Gedrimiene et al., 2022). This study focuses on the use of LADs as a support for the study planning and monitoring process, thus providing new evidence about the relevance and usefulness of the designed LADs.
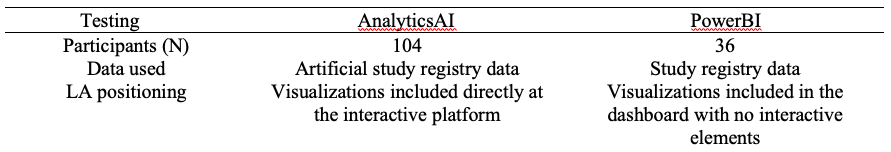
The LADs were developed in two Finnish universities in interdisciplinary developer teams. The LADs use students’ registry-based data (PSPs, credits achieved, timeline of achieved credits) and degree-structure information. The goal of both LADs was to facilitate the process in which a student creates a PSP, sets goals for studies, and monitors the enacting of one’s plans. In this study, one dashboard pilot constituted a case. In the two cases, the participants were higher education students who had a task to plan and monitor their studies with the help of the LAD feedback. The cases were different in terms of the dashboard design (AnalyticsAI and PowerBI) and the participant group (table 1). The two cases provided a window to understand similarities and differences in students’ evaluations of the two different LAD designs. This information is important to further improve academic path-level support for students via LADs.
Table 1
Overview of the two cases in the study
3.1.1 AnalyticsAI
AnalyticsAI focused on interactively supporting the PSP creation process by providing real-time feedback (Figure 1). To help students to create a quality plan, feedback was provided about the 1) number of courses chosen, 2) division of the workload, and 3) parts of the degree included in the plan. LA was positioned to provide feedback for students while they were modifying the suggested template of their studies or when students wanted to see how their studies were progressing. The visualizations filtered information about 1) the institutional requirements for the academic path, 2) the individual goals the students had set for their PSP, 3) the student’s prior activity, and 4) the timeline for the studies. The dashboard visualized how many courses students had completed from their PSPs (Figures 2,3), and how their progression speed responded to the graduation time goal they had set. The dashboard included recommendations about the courses that others with similar plans had chosen. The content was divided into three main sections, where the “Dashboard” and “Studies” sections included information about the degree structure and PSP respectively (Figure 1). The “Timetable” section provided information about students’ course schedules and exams. The “Dashboard” section contained an overview of students’ progression according to the created PSP and selected degree structure (Figure 1).
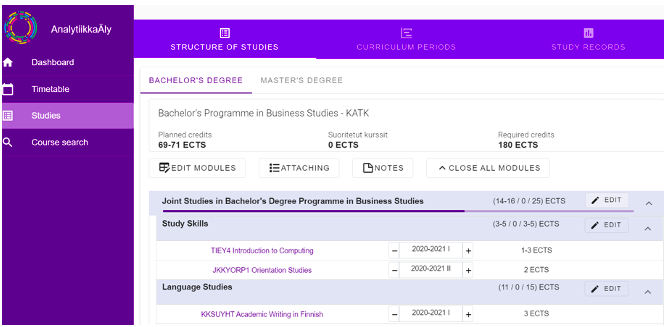
Figure 1. Study planning view: a planning template that students modify by adding and removing courses. Students can overview the structure of the studies, see how their studies divide within study periods, and see their study records to update the PSP.
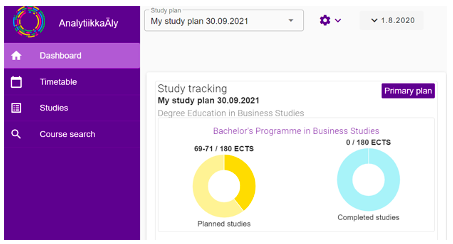
Figure 2. Visualization of student’s planned and completed courses for bachelor's degree.
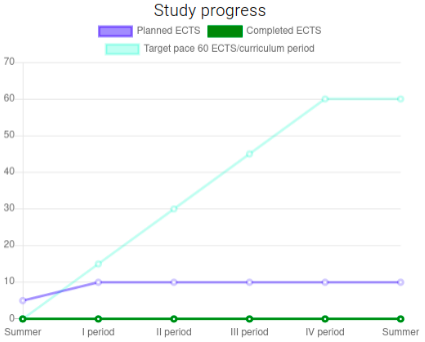
Figure 3. Visualization of students’ progression during an academic year, comparison with the planned ECTs with the completed ECTs.
3.1.2 PowerBI
In PowerBI the content was divided to visualize the PSP and to provide an overview of the current progression in the studies. Students could modify their PSP based on the provided feedback in the platform separate from PowerBI. The visualizations provided information about 1) individual goals that students set for their PSPs (Figure 4), 2) information about a students’ own prior activity, including timelines of study progression (Figure 5), 3) the distribution of the grades according to the study field and degree part (Figure 3) 4) peer comparison information to support monitoring (Figure 6), 4) and an estimation of the graduation time based on the number of completed and required credits for a given degree program. With the help of the dashboard, students could take an overview of their ongoing and upcoming courses selected into their PSP during the one academic year (Figure 6).
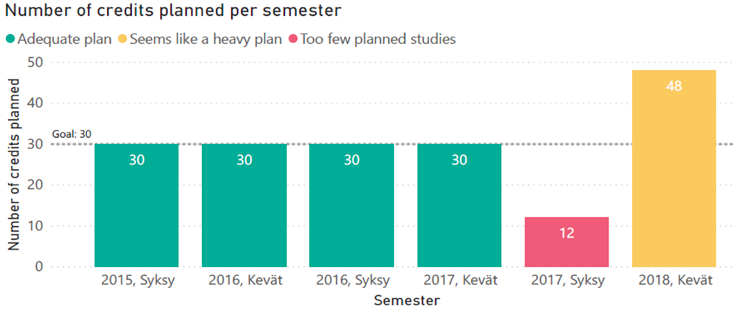
Figure 4. Planning view of PowerBI dashboard
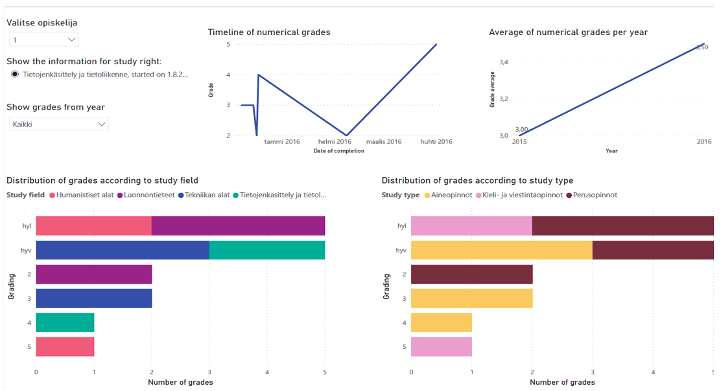
Figure 5. Visualizations of student grades (Gedrimiene et al., 2022). On the first row: a) Timeline of students’ numerical grades on courses, b) Average of numerical grades per year. On the second row: c) distribution of the grades according to study field, d) distribution of grades according to study type.
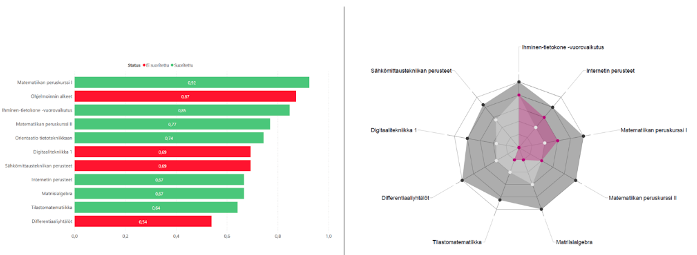
Figure 6. Overview of student progression based on the PSP for the selected year. Left: bar plot indicating planned and completed courses including peer completion comparison. Right: radar plot with peer grade comparison (Gedrimiene et al., 2022).
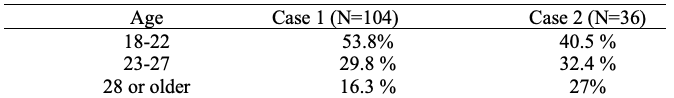
In case 1, the use of artificial study registry data in the testing enabled participation in the study with different levels of experience from HE studies. Participants (n = 104) were from five Finnish universities (37 male, 67 female) from various fields, such as natural sciences, engineering, ICT fields, health sciences, educational sciences, economics, medicine, humanities, and social sciences. The sample consisted of 76 Finnish students and 28 international students at various stages of their studies, the age distribution is presented in Table 2.
In case 2, the use of study registry information in the testing limited the group of participants to those who already had studied in university at least one year and already had completed and planned courses in their study registry. Participants (n = 36) were from a Finnish university (20 female, 16 male). The sample consisted of 20 bachelor’s phase and 16 master’s phase students from educational sciences (23 students) and electrical engineering (13 students). The age distribution is presented in Table 2. Students from educational sciences and electrical engineering were invited to participate in the study so that feedback from students with different educational backgrounds would be obtained.
Table 2
Age of participants
Research data was collected through an online questionnaire, and the same protocol was used to collect data in both cases. Data collection protocol included pre-questionnaire, instructed LAD testing, and post-questionnaire. Students were introduced to LAD use with the instructions included in the protocol. Likert-scale questionnaire items measured students’ self-efficacy beliefs and resource management strategies (based on the MSLQ, Pintrich et al., 1991), and open-ended questions measured students’ evaluations of the LADs.
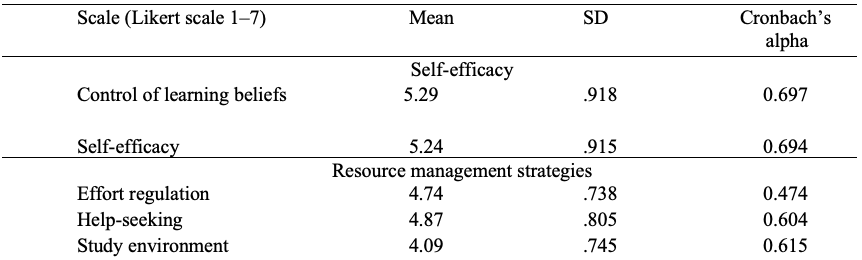
The pre-questionnaire consisted of items on student background information (age, gender, grade, field) and two modules from the Motivated Strategies for Learning Questionnaire (MSLQ). The first module was self-efficacy beliefs including the scales control of learning beliefs (example question: If I try hard enough, then I will understand the contents in my studies) and self-efficacy beliefs (I believe I will receive excellent grades in my studies). The second module was resource management strategies including the scales effort regulation (Even when course materials are dull and uninteresting, I manage to keep working until I finish), help-seeking (When I can't understand the course material, I ask another student for help) and study environment (I have a regular place set aside for studying) and time management strategies (I often find that I don't spend very much time on my studies because of other activities) (Table 3, Pintrich et al., 1991). The reliability of the MSLQ items was tested with Cronbach’s alpha values for each scale (Table 3). The internal consistency values for the questionnaire scales were similar to the original values of Pintrich et al. (1991) except for the effort regulation scale, which remained lower (0.47) than the original (0.69). One item was removed from the help-seeking scale to improve internal consistency. In the pre-questionnaire, students evaluated their self-efficacy beliefs and resource management strategies using seven-point Likert scale items from 1 (strongly disagree) to 7 (strongly agree). Students were asked to think about their university studies at a general level when answering these questions.
Table 3
Descriptive statistics for the selected questionnaire scales (Pintrich et al., 1991).
In the post-questionnaire, student evaluations were collected through three open-ended questions focused on support and challenge aspects that students identified when using the dashboards for study planning and monitoring:
1) What things (in the service) were useful in planning and monitoring your studies?
2) What things were challenging?
3) How would you develop the service?
Data analysis was conducted in three parts. First, qualitative Content Analysis was selected as an analytical approach to enable systematic and quantifiable analysis of open-ended answers (Chi, 1997). In the second phase, the results of the analysis were quantified. Finally, t-tests were conducted to analyze the association with students’ evaluations, self-efficacy beliefs, and resource management strategies (RQ3).
3.4.1 Qualitative content analysis
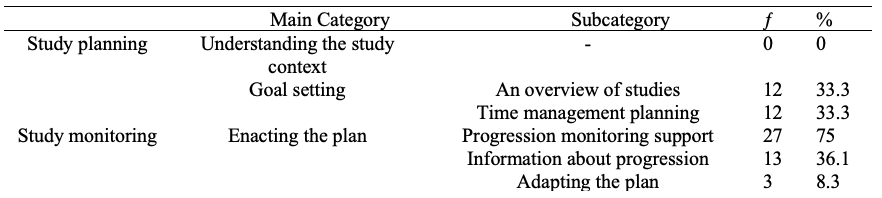
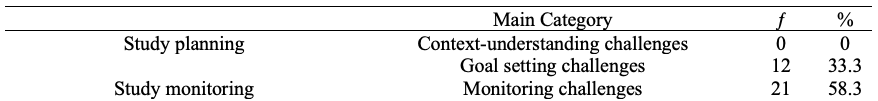
Four phases of SRL (Winne & Hadwin, 1998) were used as main categories to structure the analysis of student evaluations of the LA dashboards (Table 4). The fourth phase of the model, the adaptation of the plan, was left out of the analysis since the research design did not enable students to evaluate how the dashboards could support adaptation phase. The coding scheme focused on identifying how LADs supported study planning and monitoring processes and what kind of challenges students identified in using LADs.
Table 4
Coding scheme for main categories to analyze student evaluations of LADs’ support and challenge aspects (White, 2015; Winne, 2011; Winne & Hadwin, 1998)
Open-ended answers from cases 1 and 2 were first analyzed separately. At first, the responses were categorized into support or challenge aspects and then divided into the three phases of SRL based on the theory-oriented category descriptions in Table 4. Support and challenge aspects were analyzed separately. Subcategories were formulated based on the themes that arose from the data. This allowed analysis of what kind of aspects students emphasized as supportive or challenging in LADs. The unit of analysis was one mentioned theme in the open-ended answer and the length of the unit of analysis varied from one word to one sentence. One open-ended answer could include several units of analysis. No overlapping was allowed between coding categories. The reliability of the coding was ensured by two coders coding 15% of the open-ended answers. Cohen’s kappa was calculated at K = 0.96, which indicates high reliability (Salkind, 2010).
The data from both cases were combined into one dataset, and all qualitative main- and subcategories were quantified by transforming each response into a discrete variable (1 = response in the category, 0 = no response in the category) for the quantitative analyses. Similar main- and subcategories were identified from both cases for further analysis. The categories identified from both cases were time management planning from the goal setting phase (N(0) = 108, N(1) = 32), the enacting-the-plan phase (N(0) = 108, N(1) = 32), and goal setting challenges (N(0) = 82, N(1) = 58). Thus, the common categories were selected for further analysis.
3.4.2 Quantitative data analysis
To analyze the association of self-efficacy beliefs and resource management strategies with the student evaluations of the dashboard support and challenges, Welch t-tests were conducted. Welch t-test was used, as it is better than a Student’s t-test at comparing the means of two independent groups when sample sizes and variances are not equal between the groups. A t-test was conducted between each measured subscale (control of learning beliefs, self-efficacy, effort regulation, help-seeking, and study environment) and such main- and subcategories that were common for both cases (time management planning from goal setting phase, enacting-the-plan phase, and goal setting challenges).
4.1.1. AnalyticsAI
Student evaluations of AnalyticsAI emphasized the support for the context-understanding and goal setting phases of SRL (Table 5).
Table 5
Support aspects for study planning and monitoring that student evaluated in AnalyticsAI.
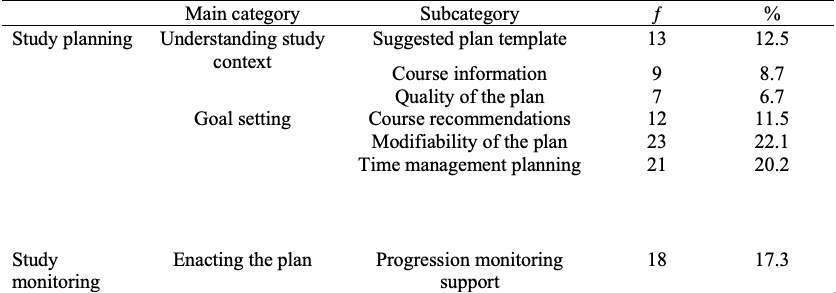
At the context-understanding phase, students found that the dashboard helped them to understand how to start planning their degree by providing a suggested plan template (ƒ = 13): “The suggested degree structure that enables adding and removing courses” and “Mandatory contents of the degree available in the suggested plan.” They explained it as a fluent way of planning to start modifying the plan based on the degree requirements and their own interests. Also, a tool provided information about the courses (ƒ = 9): “Periodic course search seems like an easy way to find more courses”. and some students liked that they got important feedback about whether their plan met the institutional requirements for the degree (ƒ = 7): “Seeing how to divide your classes in order to graduate earlier”.
Many student evaluations of AnalyticsAI were focused on the goal setting phase. Students found that the tool supported them by providing insights for workload planning and time management (ƒ = 21): “The view for the academic year was useful since it enabled to plan the timing of the courses and the division of the courses between academic years” and “It was easy to follow the workload of the studies in the planning phase.” Students also felt that the course recommendations (ƒ = 12) were supporting their goal setting phase with suggestions of courses that might suit their plans: “It's good that the system already has courses built in. It was easy to choose the courses based on that.”. The modifiability of the plan (ƒ = 23) helped students to set relevant goals: “You got options for creating several study plans and modify it”. Students could first try out different plans and see from the visualizations what these plans would look like.
At the enacting-the-plan phase, students reported that the views on the tool could support their progression monitoring (ƒ = 18). They described the views that showed their completed courses and the overview about the study progress as important: “Possibility to follow my studies in a timely manner” and “It is easy to see past and upcoming studies as a whole and by study periods.” Students specifically mentioned that the possibility to see completed and upcoming planned courses in the same view on the front page was useful for them.
Students identified challenges, support needs, and development ideas related to the context-understanding and goal setting phases of SRL (Table 6). Students reported a need for more information about the study structures (ƒ = 29) to be able to better plan their studies: “Maybe making things more fluent for beginners and recommending studies by default could be a good idea because someone who knows what they are doing can easily remove things, while someone who has no idea what they are doing may need some help.” They suggested that the service could provide more information that is typically provided through study guidebooks, such as:” More instructions about the structure of the degree or at least a link for a study guide from which you could easily see the structure.” These were for example pre-requirements of the courses, the rules of how and what major and minor studies should be chosen, information about language studies, and more step-by-step guidance on how to formulate a PSP.
Table 6
Challenges students identified when using AnalyticsAI.
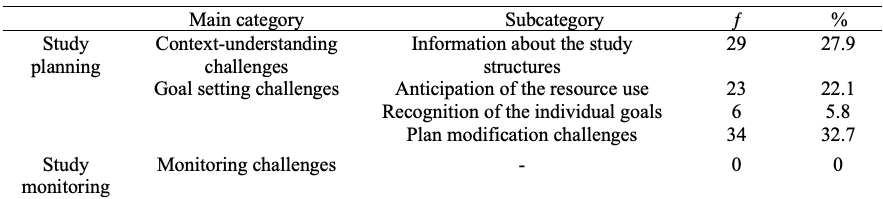
Students suggested that the tool could provide even more support for the anticipation of their resource use as a support for goal setting (ƒ = 27): “To think how many courses I can have a year” and “To see if courses overlap.” Some students reported that it was difficult to recognize individual interests (ƒ = 6) and that there were also technical difficulties with modifying the plan (ƒ = 34), such as adding or choosing courses: “(It is difficult) to find the courses for the right period. The calendar could have periods separately, or there could be a whole year view added.”
4.1.2. PowerBI
PowerBI specifically supported the goal setting and enacting-the-plan phases of SRL (Table 7). Students felt that the tool was important in formulating and overviewing their studies.
Table 7
Support aspects students identified in PowerBI.
For goal setting phase, students described that PowerBI provided them an important overview of their studies (ƒ = 12), such as the number of credits in each semester, seeing course credits separately and in total, and views that helped to get an overview of a planned academic path: “It shows my credits and subjects from my studies, it helps me plan and look at the projection” and “I can see the courses credits separately and in total, which gives a good idea for my plan in addition to having filters and visualizations.” Students found that the tool helped them with time management planning, such as workload division in each study period (ƒ = 12). At the enacting-the-plan phase, students described that PowerBI supported their progression monitoring (ƒ = 27) by providing important overviews of completed and planned courses. Students mentioned that the views provided them with information about the longer-term course performance and allowed them to reflect on upcoming semesters as well. Students liked the possibility of seeing an estimation of their graduation time based on their current progression speed: “The views can help to notify that with this pace graduation will not happen according to the originally planned schedule.” Some students explained that these monitoring views also helped them to adapt their upcoming plans based on their current evaluations of how they were doing (ƒ = 3). Students found that the dashboard could help them to notice if they were not going to graduate according to their plan and helped in deciding what kinds of actions to take next.
The tool provided students with information on their progression (ƒ = 13), especially through the view in which they could compare their own grades with those of their peers, as well as insights into how they were doing with their courses: “It is interesting to see my grades compared to others. It is also interesting to see in picture form how I am progressing in my study plan” and “The information about the performance of other students helps me to better understand my own study (success).”
Students identified challenges, support needs, and development ideas related to the goal setting and enacting-the-plan phases of SRL (Table 8). As the sample size was smaller than that in case 1, no subcategories were identified from the challenge aspects in the PowerBI case.
Table 8
Challenges students identified in PowerBI.
For the goal setting phase (ƒ = 12), students suggested more clarity in visualizations that helps planning or that it did not provide enough ideas about further opportunities and alternatives. Some students described that they did not have an idea about how to modify their study plans: “It does not give me ideas about further opportunities and alternatives” or that the dashboard was not very relevant to their degree: “However, most of the courses in our program are mandatory, so I don't have much space to plan the courses by myself, so I am not sure if I can make good use of this tool as much.”
As a challenge for monitoring (ƒ = 21), students found that the tool would provide them with information in more detail, or that the information was not relevant from the aspect of their study field: “It isn't super useful, I think, primarily I personally have a good sense of the progression and courses just by looking at my PSP.” Some students explained that in their field, many courses are assessed as either passed or failed when some of the visualizations (radar plot) did not show relevant information for them. Additionally, students recommended that the dashboard could suggest certain electives to choose from for upcoming studies or provide more predictions of their degree progression.
The results of the qualitative content analysis show that both dashboards, AnalyticsAI and PowerBI, supported students to analytically reflect on their study planning and monitoring processes. The support and challenge aspects of AnalyticsAI addressed that the dashboard focused especially on the study planning process, while the PowerBI visualizations were discussed more from the study monitoring aspects. In the following sections, the results of the qualitative content analysis are described.
According to the results of the Welch t-tests, self-efficacy had a significant association with the student evaluations of the dashboard in the goal setting phase (Table 9). The results of the t-tests indicate that students who mentioned time management planning as a supportive aspect of the dashboards had significantly higher self-efficacy than those who did not mention it; t(49) = -2.92, p = .005. Students who mentioned challenges in the goal setting phase had significantly lower self-efficacy, t(123) = 2.64, p = .009, compared to the students who did not mention them.
From the subscales of resource management strategies, students who identified support aspects for the enacting-the-plan phase indicated significantly lower help-seeking compared to those who did not mention it; t(76) = 1.06, p = .043, g = .641. No other significant differences were identified from the other subscales of resource management strategies (Table 9).
Table 9
T-test results for the categories of time management planning and enacting the plan as supportive aspects of the dashboard. Goal setting challenges as challenging aspects.
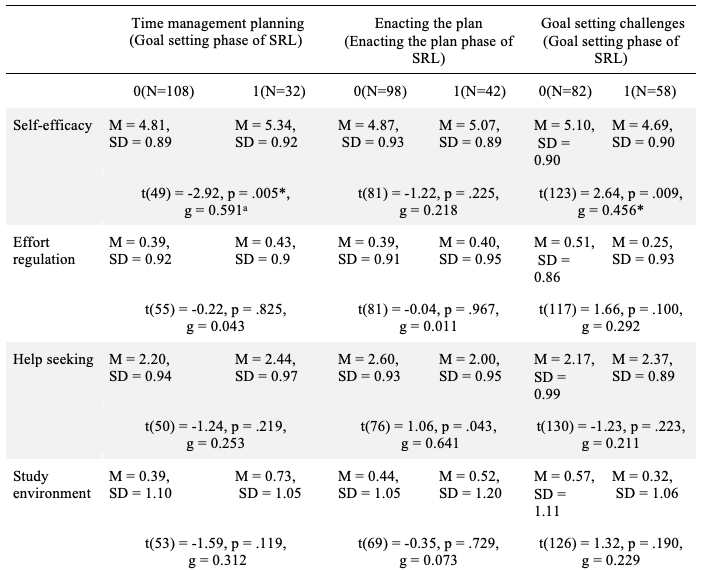
Note: 0 = students who did not mention the category in their open-ended answers, 1 = students who mentioned the category in their open-ended answers. a= Hedges’ g.
In this study, student evaluations of two different LADs as support for study planning and monitoring were examined through two cases. The findings of this study showed that both LADs provided useful feedback for study planning and monitoring processes, but the LADs differed in terms of how support was divided within the three phases of SRL. The challenges emerged especially due to the granularity level of the feedback provided. Furthermore, students’ evaluations of the LADs differed based on their self-efficacy beliefs and help-seeking skills.
The study planning process was supported especially by AnalyticsAI. AnalyticsAI provided information for understanding the context of planning the studies. However, the lack of sufficient information for understanding the planning context was raised as a challenge. Both AnalyticsAI and PowerBI provided support for goal setting phase. Specifically, support for planning time management was considered useful in both LADs. Also, many challenges were reported in the goal setting phase, in particular, related to challenges in editing the plan, and time management planning in the goal setting process. Some students reported that it was difficult to set goals for their PSP, since it was difficult to recognize their individual goals and interests. This finding could be used to develop both more student-centered information sources of students’ goals for LADs, and to develop academic advising practices that utilize such LADs, but also guide students to reflect on their personal goals. In PowerBI, planning was supported by an overview of studies and views supporting time planning. However, students suggested development of the PowerBI in terms of providing more insights into how to adjust their plans based on the provided information. In previous studies of LADs, support for planning and organizing studies has been considered important by the students (Schumacher & Ifenthaler, 2018). Furthermore, supporting goal setting phase has been well included in the dashboard designs aiming to support SRL processes (Viberg et al., 2020).
Study monitoring process support was highlighted in PowerBI. Here, students described that the overview of studies -view in particular helped students to visualize how their studies have progressed in relation to their PSP, what the current study progression looks like in relation to the estimated time of completion. Some students described that the overview made it easy to plan what changes were needed to their own plans. However, this was contradictory with some students criticizing overviews in the planning process for not giving actionable feedback for the planning process. AnalyticsAI also supported monitoring by providing views of the student's progress. For both LADs, the challenge was that more detailed information on progress was needed to support monitoring. This is an important finding for developing LA design and use in academic path-level studies. In addition, some students reported that the data did not seem as actionable for the students from different study fields. It has been noted that the structure and goals of the degrees vary between fields.
In the testing of LADs, students identified aspects that could help them to refine thinking about their academic path, with added knowledge for decisions about the next steps and adjusting plans. These findings are in line with the previous research suggesting that LADs can help students identify upcoming next steps in their learning and elaborate their thinking about their learning (Aguilar et al., 2021; Jivet et al., 2020). The students in the two cases evaluated the LADs in different phases of their academic paths. In case 1, students were from different grades, but it is expected that many of them had the planning task ahead when the data was collected during the opening event of an academic year. In case 2, students were 3rd and 4th year students, who already have created their PSPs and may benefit more from the monitoring views. Thus, more research would be needed about the support needed for planning and monitoring processes in different phases of academic paths.
One important advance of LA is to provide personalized feedback to different students (Van Leeuwen et al., 2022). In this study, the association with students’ evaluations, self-efficacy beliefs, and resource management strategies were examined. Students who found that the dashboards helped them with time management planning had higher self-efficacy beliefs than those who did not report such support. Furthermore, students who reported challenges with LAD in goal setting had lower self-efficacy beliefs than those who did not report challenges. These results support hypothesis 1. In the tested LADs, time management planning was guided with several visualizations, and it emerged as an important support aspect for goal setting phase of SRL. Based on previous research, setting can be challenging for students with low self-efficacy (Zimmerman, 2000). There is a need to consider students' perceptions of self-efficacy in LA design so that LA tools do not only support students who are already successful in their studies. The findings are in line with Rets et al. (2021) study in which students’ self-efficacy beliefs impacted how useful they perceived the feedback provided via dashboards.
Students who evaluated the dashboards as helpful in study monitoring had lower help-seeking skills. No associations were found with other resource management strategies. Therefore, hypothesis 2 is only partially supported. The findings align with the previous research showing how students’ help-seeking skills associate with the perceived usefulness of LADs for monitoring learning (Aguilar & Baek, 2019; Jivet et al., 2018). This finding is essential for the development of LA to support monitoring. Especially in online and hybrid contexts, it can be more challenging for students to activate different learning strategies (Broadbent, 2017). On the level of academic paths, it can also sometimes be challenging to identify from students’ perspective, where to ask for help with learning or study-related issues. Thus, LA might serve an important role on the level of academic paths by providing a channel for students to receive relevant and timely feedback from institutional rules and requirements.
The results align with the previous studies addressing that one design does not provide the necessary support for all students, but individual and contextual differences should be acknowledged in LAD design (Teasley, 2017). Using LA can improve students’ self-efficacy beliefs and academic performance ( Yilmaz, 2022; Russell et al., 2020). However, individual differences in students’ capacities to utilize provided feedback productively should be further investigated.
This study has some limitations that should be considered when interpreting the results. First, the study aimed to identify how student evaluations divide within the phases of SRL. However, the research design did not address if the dashboards supported the fourth phase of SRL, namely adaptation of the plan. This phase is an essential part of SRL process during which students adapt their goals, plans and behaviors in terms of their evaluation and monitoring of their learning. Thus, future studies should address how students evaluate such dashboards supporting all four phases of the SRL.
In the qualitative content analysis, the response rates to open-ended questions remained rather low, especially in case 1. In the t-test analyses, only three categories were identified as comparable between the cases. Due to this, only goal setting and monitoring phases of SRL were included in the t-tests. The variation in responses to assessing their self-efficacy beliefs and resource management strategies was relatively small, and students overall rated their skills as quite high. These limitations might influence the reliability of the findings. Furthermore, the study has some limitations regarding the generalizability of the findings. As the study focused on the participants’ unique characteristics, self-efficacy beliefs, and help-seeking skills, and the student evaluations focused on the two specific LADs, the findings may be unique to the selected context and student population, and they may not be generalizable to other educational settings or student populations.
There is a need for LA tools that can help students carrying out their studies successfully (Ifenthaler & Yau, 2020). The results offer two contextualized examples of LADs as a support for students’ self-regulation on the level of academic paths. The findings showed that students considered visualizations as a support for planning and monitoring useful and relevant, but they raised multiple information needs, which highlighted the need for more detailed LA feedback for academic path-level contexts. This means identifying new indicators and addressing new sources of data to enrich the provided feedback on the academic path level. For example, combining course-level data with existing registry data could provide access to visualize long-term SRL processes and help students to improve their SRL skills across the study periods and academic years.
In open, hybrid, and online environments, a need for self-regulated learning is increased (Jansen et al., 2020). LADs can foster students’ SRL (Viberg et al., 2020). Theory-informed, contextualized understanding of student perspectives is important in creating LADs that encourage students to take ownership of their studies (Ochoa & Wise, 2021; Stenalt, 2021). This study provided an understanding of how the SRL process occurs on the academic path-level. For example, the requirements for context understanding support, and monitoring processes appeared different from the task-specific process of SRL. Supporting students’ SRL in the context of academic paths can help students to improve their academic performance, but it also builds a ground for the development of their competencies as future professionals.
The use of student-facing LADs requires careful planning and consideration of the practices in which the LADs are used. Students with low self-efficacy beliefs reported more challenges in goal setting phase than the students with high self-efficacy beliefs. It is important for teachers and academic advisors to acknowledge the possible differences in students’ capacities to utilize provided feedback independently. Thus, guiding students’ reflection process of the provided feedback might help different students to benefit from provided visualizations. A better understanding of student experiences on online learning technologies helps to understand how these technologies influence students’ academic outcomes and support their agency (Stenalt, 2021).
This work was supported by the
Ministry of Education and Culture, Finland [grant number OKM/272/523/2017].
Suomen kulttuurirahasto, Finnish Cultural Foundation
OLVI-säätiö, OLVI-foundation
Aguilar, S. J., & Baek, C. (2019). Motivated information seeking and
graph comprehension among college students.
ACM International Conference Proceeding Series
, 280–289. https://doi.org/10.1145/3303772.3303805
Bandura, A. (1977). Self-efficacy: Toward a unifying theory of behavioral
change. Psychological Review, 84(2), 191–215.
https://doi.org/10.1037/0033-295X.84.2.191
Broadbent, J. (2017). Comparing online and blended learner’s self-regulated
learning strategies and academic performance.
The Internet and Higher Education
, 33, 24–32. https://doi.org/10.1016/J.IHEDUC.2017.01.004
Chi, M. T. H. (1997). Quantifying Qualitative Analyses of Verbal Data: A
Practical Guide. Journal of the Learning Sciences, 6(3),
271–315. https://doi.org/10.1207/s15327809jls0603_1
Dresel, M., Schmitz, B., Schober, B., Spiel, C., Ziegler, A., Engelschalk,
T., Jöstl, G., Klug, J., Roth, A., Wimmer, B., & Steuer, G. (2015).
Competencies for successful self-regulated learning in higher education:
structural model and indications drawn from expert interviews.
40(3), 454–470. https://doi.org/10.1080/03075079.2015.1004236
Gedrimienė, E., Silvola, A., Kokkonen, H., Tamminen, S., & Muukkonen, H.
(2022). Addressing Students’ Needs: Development of a Learning Analytics Tool
for Academic Path Level Regulation. In E. de Vries, Y. Hod & J. Ahn
(Eds).
Proceedings of the 15th International Conference of the Learning
Sciences
. https://doi.org/10.1016/j.chb.2014.07.013
Greene, J. A., & Azevedo, R. (2007). A theoretical review of Winne and
Hadwin’s model of self-regulated learning: New perspectives and directions.
Review of Educational Research, 77(3), 334–372.
https://doi.org/10.3102/003465430303953
Gutiérrez, F., Seipp, K., Ochoa, X., Chiluiza, K., De Laet, T., &
Verbert, K. (2018). LADA: A learning analytics dashboard for academic
advising. Computers in Human Behavior, 107,105826.
https://doi.org/10.1016/j.chb.2018.12.004
Hacker, D.J., Dunlosky, J., & Graesser, A.C. (Eds.). (1998).
Metacognition in Educational Theory and Practice
(1st ed.). Routledge. https://doi.org/10.4324/9781410602350
Heikkinen, S., Saqr, M., Malmberg, J., & Tedre, M. (2023). Supporting
self-regulated learning with learning analytics interventions – a systematic
literature review. Education and Information Technologies,
28
(3), 3059–3088. https://doi.org/10.1007/S10639-022-11281-4/
Ifenthaler, D., & Yau, J. Y. K. (2020). Utilising learning analytics to
support study success in higher education: a systematic review.
Educational Technology Research and Development
, 68(4), 1961–1990. https://doi.org/10.1007/S11423-020-09788-Z
Jansen, R., Jansen, R. S., Van Leeuwen, A., Janssen, J., & Kester, L.
(2020). A Mixed Method Approach to Studying Self-Regulated Learning in
MOOCs: Combining Trace Data with Interviews.
Frontline Learning Research
, 8(2), 35–64. https://doi.org/10.14786/flr.v8i2.539
Järvelä, S., Hurme, T.-R., & Järvenoja, H. (2011). Self- regulation and
motivation in computer- supported collaborative learning. In Ludvigsen, S.,
Lund, A., Rasmussen, I., & Säljö, R. (Eds.).
Learning Across Sites: New tools, infrastructures and practices
(1st Ed., pp. 330–346). Routledge. https://doi.org/10.4324/9780203847817
Jivet, I., Scheffel, M., Drachsler, H., & Specht, M. (2017). Awareness
is not enough: Pitfalls of learning analytics dashboards in the educational
practice.
Lecture Notes in Computer Science (Including Subseries Lecture Notes in
Artificial Intelligence and Lecture Notes in Bioinformatics)
, 10474 LNCS, 82–96. https://doi.org/10.1007/978-3-319-66610-5_7
Jivet, I., Scheffel, M., Specht, M., & Drachsler, H. (2018). License to
evaluate: Preparing learning analytics dashboards for educational practice.
ACM International Conference Proceeding Series, 31–40.
https://doi.org/10.1145/3170358.3170421
Jivet, I., Scheffel, M., Schmitz, M., Robbers, S., Specht, M., &
Drachsler, H. (2020). From students with love: An empirical study on learner
goals, self-regulated learning and sense-making of learning analytics in
higher education. Internet and Higher Education, 47.
https://doi.org/10.1016/J.IHEDUC.2020.100758
Yilmaz, F. G. (2022). Utilizing Learning Analytics to Support Students’
Academic Self-efficacy and Problem-Solving Skills.
Asia-Pacific Education Researcher
, 31(2), 175–191.
https://doi.org/10.1007/S40299-020-00548-4/TABLES/8
Khiat, H. (2019). Using automated time management enablers to improve
self-regulated learning. https://doi.org/10.1177/1469787419866304
Kyndt, E., Donche, V., Trigwell, K., & Lindblom-Ylänne, S. (Eds.).
(2017). Higher Education Transitions: Theory and Research (1st
Ed.). Routledge. https://doi.org/10.4324/9781315617367
Lahn, L. C. (2011). Profesisonal learning as epistemic trajectories. In S.
Ludvigsen, A. Lund, I. Rasmussen, & R. Säljö (Eds.),
Learning across sites: New tools, Infrastructures and Practices
(1st Ed., pp. 53–68). Routledge.
Lang, C., Siemens, G., Wise, A., Gasevic, D. & Merceron, A. (Eds.).
(2022). Handbook of learning analytics(2nd Ed.). Society for
Learning Analytics Research. https://doi.org/10.18608/hla22
Li, Q., Xu, D., Baker, R., Holton, A., & Warschauer, M. (2022). Can
student-facing analytics improve online students’ effort and success by
affecting how they explain the cause of past performance?
Computers & Education
, 185, 104517. https://doi.org/10.1016/J.COMPEDU.2022.104517
Lim, L. A., Dawson, S., Gaševic, D., Joksimović, S., Fudge, A., Pardo, A.,
& Gentili, S. (2020). Students’ sense-making of personalised feedback
based on learning analytics.
Australasian Journal of Educational Technology
, 36(6), 15–33. https://doi.org/10.14742/AJET.6370
Ludvigsen, S., Lund, A., Rasmussen, I., & Säljö, R. (Eds.). (2010).
Learning Across Sites: New Tools, Infrastructures and Practices (1st
ed.). Routledge. https://doi.org/10.4324/9780203847817
Ludvigsen, S., Rasmussen, I., Krange, I., Moen, A., & Middleton, D.
(2011). Intersecting trajectories of participation: temporality and
learning. In S. Ludvigsen, A. Lund, I. Rasmussen, & R. Säljö (Eds.),
Learning Across Sites: New tools, infrastructures and practices
(1st editions, pp. 105–121). Routledge.
https://doi.org/10.4324/9780203847817
Matcha, W., Ahmad Uzir, N., Gasevic, D., & Pardo, A. (2019). A
Systematic Review of Empirical Studies on Learning Analytics Dashboards: A
Self-Regulated Learning Perspective.
IEEE Transactions on Learning Technologies
, 13(2), 226–245. https://doi.org/10.1109/tlt.2019.2916802
Mendez, G., Galárraga, L., & Chiluiza, K. (2021). Showing academic
performance predictions during term planning: effects on students’
decisions, behaviors, and preferences.
In Proceedings of the 2021 CHI Conference on Human Factors in Computing
Systems, 22
, 1–17.
https://doi.org/10.1145/3411764.3445718
Ochoa, X., & Wise, A. F. (2021). Supporting the shift to digital with
student-centered learning analytics.
Educational Technology Research and Development
, 69(1), 357–361.
https://doi.org/10.1007/S11423-020-09882-2/METRICS
Panadero, E. (2017). A Review of Self-regulated Learning: Six Models and
Four Directions for Research. Frontiers in Psychology, 8,
422–422. https://doi.org/10.3389/fpsyg.2017.00422
Pelletier, K., McCormack, M., Reeves, J., Robert, J., Arbino, N., Al-Freih,
M., Dickson-Deane, C., Guevara, C., Koster, L., Sánchez-Mendiola, M.,
Skallerup Bessette, L., & Stine, J. (2022).
2022 EDUCAUSE Horizon Report | Teaching and Learning Edition | EDUCAUSE
Library
. EDUCAUSE Horizon Report.
https://library.educause.edu/resources/2022/4/2022-educause-horizon-report-teaching-and-learning-edition
Pintrich, P. R. R., Smith, D., Garcia, T., & McKeachie, W. (1991). A
manual for the use of the Motivated Strategies for Learning Questionnaire
(MSLQ). National Center for Research to Improve Postsecondary Teaching and
Learning. https://doi.org/ED338122.
Rets, I., Herodotou, C., Bayer, V., Hlosta, M., & Rienties, B. (2021).
Exploring critical factors of the perceived usefulness of a learning
analytics dashboard for distance university students.
International Journal of Educational Technology in Higher Education
, 18(1), 1–23.
Russell, J. E., Smith, A., & Larsen, R. (2020). Elements of Success:
Supporting at-risk student resilience through learning analytics.
Computers and Education
, 152. https://doi.org/10.1016/j.compedu.2020.103890
Schumacher, C., & Ifenthaler, D. (2018). Features students really expect
from learning analytics. Computers in Human Behavior, 78,
397–407. https://doi.org/10.1016/j.chb.2017.06.030
Schunk, D. H. (1991). Self-efficacy and academic motivation.
Educational Psychologist
, 26(3–4), 207–231.
https://doi.org/https://doi.org/10.1207/s15326985ep2603&4_2
Schunk, D.H., & Greene, J.A. (Eds.). (2017).
Handbook of Self-Regulation of Learning and Performance
(Vols. 1–2).Routledge. https://doi.org/10.4324/9781315697048
Silvola, A., Näykki, P., Kaveri, A., & Muukkonen, H. (2021a).
Expectations for supporting student engagement with learning analytics: An
academic path perspective. Computers & Education, 168, 104192.
https://doi.org/10.1016/j.compedu.2021.104192
Silvola, A., Sjöblom, A., Svensk, S., Lallimo, J., Näykki, P. &
Muukkonen, H. (2021b, August 23-27).
Student engagement across academic paths: using LA as a support for
study planning and monitoring
[Conference presentation abstract]. The19th Biennial EARLI Conference for
Research on Learning and Instruction.
https://earli.org/assets/files/BOA-2021.pdf
Stenalt, M. H. (2021). Digital student agency: Approaching agency in digital
contexts from a critical perspective. Frontline Learning Research,
9(3), 52–68. https://doi.org/10.14786/FLR.V9I3.697
Teasley, S. D. (2017). Student Facing Dashboards: One Size Fits All?
Technology, Knowledge and Learning
, 22(3), 377–384. https://doi.org/10.1007/S10758-017-9314-3
Tempelaar, D. (2019). Supporting the less-adaptive student: the role of
learning analytics, formative assessment and blended learning.
Assessment and Evaluation in Higher Education
45(4), 579–593. https://doi.org/10.1080/02602938.2019.1677855
Van Leeuwen, A., Teasley, S. D., & Wise, A. F. (2022). Teacher and
Student Facing Learning Analytics. In Lang, C., Siemens, G., Wise, A.,
Gasevic, D. & Merceron, A. (Eds.). (2022).
Handbook of learning analytics
(2nd Ed., pp 130-140). Society for Learning Analytics Research.
https://doi.org/10.18608/hla22
Vanthornout, G., Catrysse, L., Coertjens, L., Gijbels, D., & Donche, V.
(2017). The development of learning strategies in higher education: impact
of gender and prior education. In E. Kyndt, V. Donche, K. Trigwell, & S.
Lindblom-Ylänne (Eds.),
Higher Education Transitions: Theory and Practice
(1st edition, pp. 1–322). Routledge.
Viberg, O., Khalil, M., & Baars, M. (2020). Self-regulated learning and
learning analytics in online learning environments: A review of empirical
research.
Proceedings of the Tenth International Conference on Learning
Analytics & Knowledge
, 524–533.
https://doi.org/10.1145/3375462.3375483
White, E. R. (2015). Academic Advising in Higher Education: A Place at the
Core. The Journal of General Education, 64(4), 263–277.
Winne, P. (2011). A Cognitive and Metacognitive Analysis of Self-Regulated
Learning. In Schunk, D.H., & Greene, J.A. (Eds.).
Handbook of Self-Regulation of Learning and Performance
(1st Ed., pp.15–32) Routledge. https://doi.org/10.4324/9781315697048
Winne, P., & Hadwin, A. (1998). Studying as self-regulated learning. In
D. J. Hacker, J. Dunlosky, & A. C. Graesser (Eds.),
Metacognition in educational theory and practice
(pp. 277–304). Lawrence Erlbaum Associates Publishers.
Yin, R. K. (2009). Case study research: design and methods. In
Case Study Research: Design and Methods
(4th ed). Sage Publications.
Zimmerman, B. J. (2000). Self-Efficacy: An Essential Motive to Learn.
Contemporary Educational Psychology
, 25(1), 82–91. https://doi.org/10.1006/CEPS.1999.1016